Transcription of SEPARATION TECHNIQUES - uspbpep.com
1 Chromatographic SEPARATION techniquesEUROPEAN PHARMACOPOEIA , by passing the pressurised solvent through apulse-damping device. Tubing and connections are capableof withstanding the pressures developed by the controlled systems are capable of accuratelydelivering a mobile phase in either constant or varyingconditions, according to a defined programme. In the case ofgradient elution, pumping systems which deliver solvent(s)from several reservoirs are available and solvent mixing canbe achieved on either the low or high-pressure side of thepump(s).InjectorsInjection may be carried out directly at the head of thecolumn using a phasesStationary phases are contained in columns which havebeen described in the chapters onLiquid chromatography( ) (packed columns) andGas chromatography( )(capillary columns). A capillary column has a maximuminternal diameter ( ) of 100 phasesUsually the mobile phase is carbon-dioxide which may containa polar modifier such as methanol, 2-propanol or composition, pressure (density), temperature and flowrateoftheprescribedmobilephasemayeit herbeconstantthroughout the whole chromatographic procedure (isocratic,isodense, isothermic elution) or may vary according toa defined programme (gradient elution of the modifier,pressure (density), temperature or flow rate).
2 DetectorsUltraviolet/visible (UV/Vis) spectrophotometers and flameionisation detectors are the most commonly employeddetectors. Light scattering detectors, infrared absorptionspectrophotometers, thermal conductivity detectors or otherspecial detectors may be the test solution(s) and the reference solution(s) asprescribed. The solutions must be free from solid for assessing the suitability of the system aredescribed in the chapter onChromatographic separationtechniques( ). The extent to which adjustments ofparameters of the chromatographic system can be madeto satisfy the criteria of system suitability are also given inthis CHROMATOGRAPHICSEPARATION TECHNIQUESC hromatographic SEPARATION TECHNIQUES are multi-stageseparation methods in which the components of a sampleare distributed between 2 phases, one of which is stationary,while the other is mobile.
3 The stationary phase may be asolid or a liquid supported on a solid or a gel. The stationaryphase may be packed in a column, spread as a layer, ordistributed as a film, etc. The mobile phase may be gaseousor liquid or supercritical fluid. The SEPARATION may be basedon adsorption, mass distribution (partition), ion exchange,etc., or may be based on differences in the physico-chemicalproperties of the molecules such as size, mass, volume, chapter contains definitions and calculations ofcommon parameters and generally applicable requirementsfor system suitability. Principles of SEPARATION , apparatusand methods are given in the following general methods: paper chromatography ( ), thin-layer chromatography ( ), gas chromatography ( ), liquidchromatography( ), size-exclusion chromatography ( ), supercritical fluid chromatography ( ).DEFINITIONSThe following definitions have been used to calculate thelimits in some equipment, certain parameters, such as thesignal-to-noise ratio, can be calculated using softwareprovided by the manufacturer.
4 It is the responsibilityof the user to ensure that the calculation methods usedin the software are compatible with the requirementsof the European Pharmacopoeia. If not, the necessarycorrections must be chromatogram is a graphical or other representationof detector response, effluent concentration or otherquantity used as a measure of effluent concentration, versustime, volume or distance. Idealised chromatograms arerepresented as a sequence of gaussian peaks on a DATAR etention time and retention volumeRetention measurements in elution chromatography maybegivenastheretentiontime(tR) directly defined by theposition of the maximum of the peak in the the retention time, the retention volume (VR) time or distance along the baselinefrom the point of injection to the perpendiculardroppedfromthemaximumofthep eakcorresponding to the component,v= the information section on general monographs (cover pages)EUROPEAN PHARMACOPOEIA Chromatographic SEPARATION techniquesMass distribution ratioThe mass distribution ratio (Dm) (also known as the capacityfactork or retention factor k) is defined as.
5 KC=equilibrium distribution coefficient (also knownas distribution constant),VS=volume of the stationary phase,VM=volume of the mobile mass distribution ratio of a component may bedetermined from the chromatogram using the expression:tR=retention time (or volume) or distance alongthebaselinefromthepointofinjectiont otheperpendicular dropped from the maximum of thepeak corresponding to the component,tM=hold-up time (or volume): time (or volume) ordistance along the baseline from the point ofinjection to the perpendicular dropped fromthe maximum of the peak corresponding to anunretained coefficientThe elution characteristics of a component in a particularcolumn, in size-exclusion chromatography, may be given bythe distribution coefficient (Ko)whichiscalculatedfromtheexpression:t R=retention time (or volume) or distance alongthebaselinefromthepointofinjectiont otheperpendicular dropped from the maximum of thepeak corresponding to the component,to=hold-up time (or volume).
6 Time (or volume) ordistance along the baseline from the point ofinjection to the perpendicular dropped fromthe maximum of the peak corresponding to anunretained component,tt=retention time (or volume) or distance alongthebaselinefromthepointofinjectiont otheperpendicular dropped from the maximum of thepeak corresponding to a component which hasfull access to the pores of the stationary factorThe retardation factor (RF)(alsoknownasretentionfactorRf), used in planar chromatography, is the ratio of thedistance from the point of application to the centre of thespot and the distance travelled by the solvent front from thepoint of distance of the analyte,a=migration distance of the solvent DATAThe peak may be defined by thepeak area (A)or thepeakheight (h)and thepeak width at half- height (wh)or thepeak height (h)and thepeak width between the points ofinflection (wi).
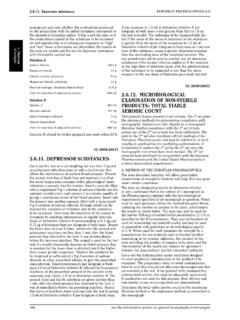
7 In gaussian peaks (Figure ) there isthe relationship:Figure factorThe symmetry factor (As) (or tailing factor) of a peak(Figure ) is calculated from the of the peak at one-twentieth of the peakheight,d=distance between the perpendicular dropped fromthe peak maximum and the leading edge of thepeak at one-twentieth of the peak value of signifies complete (ideal) (1) Chromatographic SEPARATION techniquesEUROPEAN PHARMACOPOEIA performance and apparent number of theoreticalplatesThe column performance (apparent efficiency) may becalculated from data obtained under either isothermal,isocratic or isodense conditions, depending on the technique ,as the apparent number of theoretical plates (N)fromthefollowing expression, where the values oftRandwhhave tobe expressed in the same units (time, volume or distance).tR=retention time (or volume) or distance alongthebaselinefromthepointofinjectiont otheperpendicular dropped from the maximum of thepeak corresponding to the component,wh=width of the peak at apparent number of theoretical plates varies with thecomponent as well as with the column and the retention DATAR esolutionThe resolution (Rs) between peaks of 2 components may becalculated from the expression:tR1andtR2=retention times or distances along thebaseline from the point of injection to theperpendiculars dropped from the maximaof 2 adjacent peaks,wh1andwh2=peak widths at resolution of greater than corresponds to expression given above may not be applicable if thepeaks are not baseline quantitative planar chromatography, the migrationdistances are used instead of retention times and theresolution may be calculated using the expression.
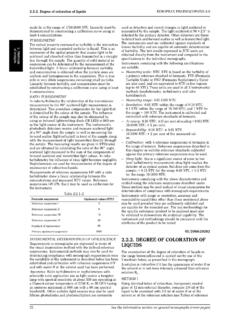
8 RF1andRF2=ratios of the distances from the point ofapplication to the centres of the spots andthedistancetravelledbythesolventfront from the point of application (retardationfactor),wh1andwh2=peak widths at half-height,a=migration distance of the solvent ratioThe peak-to-valley ratio (p/v) may be employed as asystem suitability requirement in a test for relatedsubstances when baseline SEPARATION between 2 peaks is notreached (Figure ).Hp=height above the extrapolated baseline of theminor peak,Hv=height above the extrapolated baseline at thelowest point of the curve separating the minorand major retentionTherelativeretention(r)iscalcul atedasanestimatefromthe expression:tR2=retention time of the peak of interest,tR1=retention time of the reference peak (usuallythe peak corresponding to the substance to beexamined),tM=hold-up time: time or distance along the baselinefrom the point of injection to the perpendiculardroppedfromthemaximumofthep eakcorresponding to an unretained unadjusted relative retention (rG)iscalculatedfromtheexpression.
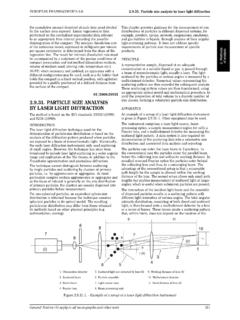
9 Unless otherwise indicated, values for relative retentionstated in monographs correspond to unadjusted planar chromatography, the retardation factorsRF2andRF1are used instead the information section on general monographs (cover pages)EUROPEAN PHARMACOPOEIA Chromatographic SEPARATION techniquesPRECISION OF QUANTIFICATIONS ignal-to-noise ratioThe signal-to-noise ratio (S/N) influences the precision ofquantification and is calculated from the equation:H=height of the peak (Figure ) correspondingto the component concerned, in the chromatogramobtained with the prescribed reference solution,measured from the maximum of the peak tothe extrapolated baseline of the signal observedover a distance equal to 20 times the width athalf-height,h=range of the background noise in a chromatogramobtained after injection or application of a blank,observedoveradistanceequalto20time sthe width at half-height of the peak in thechromatogram obtained with the prescribedreference solution and, if possible, situatedequally around the place where this peak wouldbe repeatability of response is expressed as an estimatedpercentage relative standard deviation (RSD%)ofaconsecutive series of measurement of injections orapplications of a reference solution and is calculated fromthe expression.
10 Yi=individual values expressed as peak area,peak height, or ratio of areas by the internalstandardisation method,=mean of individual values,n=number of individual maximal permitted relative standard deviation (RSDmax)is calculated for a series of injections of the referencesolution for defined limits using the following expression:K=constant ( ), obtained from the expressionin whichrepresents therequiredRSDafter 6 injections for B = ,B=upper limit given in the definition of theindividual monograph minus 100 per cent,n=number of replicate injections of the referencesolution (3 n 6),t90%,n 1=Student stat the 90 per cent probability level(double sided) withn 1 degrees of SUITABILITYThe system suitability tests represent an integral part ofthemethodandareusedtoensureadequateper formanceof the chromatographic system. Apparent efficiency, massdistribution ratio, resolution, relative retention and thesymmetry factor are the parameters which are usuallyemployed in assessing the performance of the which may affect the chromatographic behaviourinclude the composition, ionic strength, temperatureand apparent pH of the mobile phase, flow rate, columnlength, temperature and pressure, and stationary phasecharacteristics including porosity, particle size, typeof particles, specific surface area and, in the case ofreverse-phase supports, the extent of chemical modification(as expressed by end-capping, carbon loading etc.)