Transcription of Sex Composition of the Population - Registrar General and ...
1 1 Chapter 6 Sex Composition Sex Composition of the Populationof the Population Web Edition: PROVISIONAL Population TOTALS Chapter 6 Census of India 2001 Series 1, India, Paper 1 of 2001 2 SSSS eeeexxxx CCCC oooommmmppppoooossssiiiittttiiiioooonnnn ooooffff tttthhhheeee PPPP ooooppppuuuullllaaaattttiiiioooonnnn Sex Composition of the human Population is one of the basic demographic characteristics, which is extremely vital for any meaningful demographic analysis.
2 Indian Census has the tradition of bringing out disaggregated information by sex on various aspects of Population . The first and foremost is the simple count of males and females. Changes in sex Composition largely reflects the underlying socio-economic and cultural patterns of a society in different ways. Sex ratio defined here as the number of females per 1000 males in the Population , is an important social indicator to measure the extent of prevailing equity between males and females in a society at a given point of time.
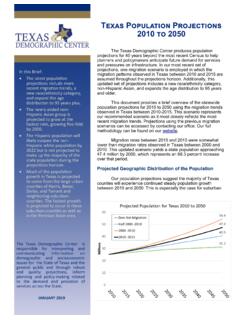
3 It is mainly the outcome of the interplay of sex differentials in mortality, sex selective migration, sex ratio at birth and at times the sex differential in Population enumeration. Statement 17 Sex ratio of selected countries Sl. No Country Sex ratio (females per 1,000 males) 1 2 3 World 986 1 China 944 2 India 933 3 1,029 4 Indonesia 1,004 5 Brazil 1,025 6 Pakistan 938 7 Russian Fed. 1,140 8 Bangladesh 953 9 Japan 1,041 10 Nigeria 1,016 Source: World Population Prospects (mid year estimates) 1998 revision, Volume 2, Sex and Age, United Nations.
4 3 It is natural for an ordinary person to believe that males and females in the Population exactly balance each other. Little do they know, how imbalanced the sexes are in different populations across the world. It has been estimated that around the year 2000, the world had 986 females against 1000 males. Statement 17 and Figure 10 present the global sex ratio and that of the ten most populous countries in the world as estimated for the year 2000. It is evident from this statement that except Indonesia and Japan, the other asian countries show low sex ratios.
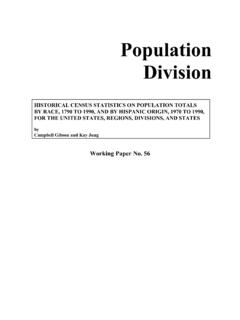
5 The sheer weight of the Population of these four asian countries with low sex ratio appears to be largely responsible for the overall preponderance of males over females in the world. The trends in sex ratio of a few selected countries for the period 1950-2000 are shown in Figure 11. It is interesting to note that the sex ratio in , Indonesia, Russian Federation and Japan has always remained above unity for the last half a century. The most dramatic decline of about 200 points in the sex ratio is seen in the Russian Federation.
6 In , it has shown as improvement from 1002 to 1029 in the last fifty years. Bangladesh has shown a continuous improvement in its sex ratio to reach from 880 in 1950 to 953 in 2000. Pakistan and China have also shown an improvement. Thus among the major nations of the world, India is the only exception. According to the Census of India, 2001, the sex ratio stands at 933 for the country as a whole. This is a welcome improvement from the 1991 Census, which had recorded 927 females for every 1000 males.
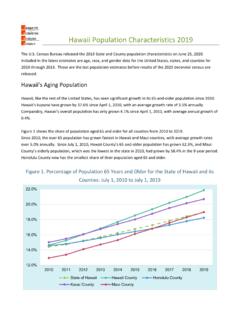
7 Statement 18 and Figure 12 present the trend in sex ratio in India since 1901. The sex ratio in the country had always remained unfavourable to females. Moreover, barring some hiccups, it has shown a long term declining trend. The sex ratio at the beginning of the twentieth century was 972 and thereafter showed continuous decline until 1941. In 1951 there was a marginal increase of one point, but thereafter it again dropped for two consecutive decades to reach 930 in 1971. In fact, between 1961-71, the country saw the sharpest decline of 11 points in the sex ratio.
8 Thereafter, it has fluctuated marginally around 930 in successive censuses. Statement 18 Sex ratio, India : 1901 2001 Census year Sex ratio (females per 1,000 males) 1901 972 1911 964 1921 955 1931 950 1941 945 1951 946 1961 941 1971 930 1981 934 1991 927 2001 933 4 Note: 1. For 1991, the interpolated figures for Jammu and Kashmir have been used. 2. While working out the sex ratio for India for the year 2001, the estimated Population of entire Kachchh district, Morvi, Maliya-Miyana and Wankaner talukas of Rajkot district, Jodiya taluka of Jamnagar district of Gujarat State and entire Kinnaur district of Himachal Pradesh have been used as the Population enumeration of Census of India, 2001 could not be conducted in these areas due to natural calamities.
9 Table 10 gives the trends in sex ratio for past hundred years in respect of all the States and Union territories, except Arunachal Pradesh, for which data is not available from 1901 to 1951. The trends in sex ratio for some of the major States are also depicted in Figure 13 as line graphs. In 1901, there were as many as eleven States and Union territories that had sex ratio of more than unity. Among these, except Kerala all other States and Union territories have shown a downward slide.
10 The major States that are largely responsible for the decline in the overall sex ratio in India are Uttar Pradesh, Bihar, Jharkhand, Orissa, Chhatisgarh, Madhya Pradesh, Gujarat, Maharashtra and Tamil Nadu. Although the sex ratio in Punjab has been consistently low, it has shown a long-term upward trend and has not contributed to the overall deterioration in sex ratio of the country. In Rajasthan, the sex ratio kept fluctuating in a narrow band and always remained at a low level.