Transcription of Shared National Credit Program
1 Shared National Credit Program 1st and 3rd Quarter 2021 Reviews Board of Governors of the Federal Reserve System Federal Deposit Insurance Corporation Office of the Comptroller of the Currency Washington, February 2022 - 1 - Table of Contents About the Shared National Credit (SNC) Program .. 2 Summary of Results .. 2 Leveraged Loans .. 2 SNC Commitments: Volume, Credit Quality, and Trends .. 3 Overall SNC Population .. 3 Leveraged Lending .. 5 COVID-19 Impacted Industries .. 6 SNC Commitments: Ownership of Risk .. 7 Appendix A: Definitions .. 9 Appendix B: Committed and outstanding Balances .. 10 Appendix C: Summary of SNC Industry Trends .. 11 Appendix D: Exposures by Entity Type .. 12 - 2 - About the Shared National Credit Program The Shared National Credit (SNC) Program assesses risk in the largest and most complex credits Shared by multiple regulated financial institutions.
2 The SNC Program is governed by an interagency agreement among the Board of Governors of the Federal Reserve System, the Federal Deposit Insurance Corporation, and the Office of the Comptroller of the Currency (the agencies). The Program began in 1977 to review credits with minimum aggregate loan commitments totaling $20 million or more that were Shared by two or more regulated financial institutions (banks). A Program modification in 1998 increased the minimum number of regulated financial institutions from two to three. To adjust for inflation and changes in average loan size, the agencies increased the minimum aggregate loan commitment threshold from $20 million to $100 million effective January 1, 2018. SNC reviews are completed in the first and third quarters of the calendar year.
3 Large agent banks receive two reviews each year while a selection of other agent banks receive a single review each year. The results discussed in this document reflect reviews conducted in the first and third quarters of 2021 and primarily cover loan commitments originated on or before June 30, 2021. Trends and exhibits shown in the report include outstanding loans and commitments by all reporting banks. Although some banks are reviewed twice a year, the agencies will continue to issue a single statement annually that captures combined findings from the previous 12 months. The next statement will be released upon completion of the third quarter 2022 SNC review. Summary of Results SNC Credit risk improved modestly in 2021 but remains high largely due to the impact of COVID-19.
4 SNC commitments with the lowest supervisory ratings1 (special mention and classified) have decreased from percent in 2020 to percent in 2021. The lower level of special mention and classified SNC commitments is driven by the recovery in commodity prices and the resulting improvement in the oil and gas sector. Improvement in oil and gas is partially offset by year-over-year weakening in commercial real estate (CRE), particularly in the hotel, office, and retail sub-sectors. SNC commitments rated special mention and classified continue to be concentrated in transactions that agent banks identified and reported as leveraged loans. Risk in leveraged loans is magnified when the obligor operates in COVID-19 impacted Although and foreign banks own the largest share of SNC commitments, including the majority of SNC commitments to borrowers in the COVID-19 impacted industries, nonbanks hold the largest share of special mention and classified loans.
5 The direction of risk in 2022 will be impacted by the continued success in managing the COVID-19 pandemic. Other current concerns include inflation, supply chain imbalance, labor challenges, high debt levels, and vulnerability to rising rates that could negatively impact the financial performance and repayment capacity of borrowers in a wide variety of industries. Leveraged Loans Credit risk associated with leveraged lending is high. Leveraged loans comprise half of total SNC 1 Supervisory ratings and related terms are defined in Appendix A. 2 COVID-19 impacted industries include entertainment and recreation, oil and gas, CRE, retail, and transportation services. - 3 - commitments but represent a disproportionately high level of the total special mention and classified exposures.
6 SNC reviews have found that many leveraged loans possess weak structures. These structures often reflect layered risks that include some combination of high leverage, aggressive repayment assumptions, weak covenants, or terms that allow borrowers to increase debt, including draws on incremental facilities. The volume of leveraged transactions exhibiting these layered risks increased significantly over the past several years and continues to grow as strong investor demand for loans enabled borrowers to obtain less restrictive terms. The accumulated risks in these transactions and the economic impact of COVID-19 contributed to a significant increase in special mention and classified exposures in 2020. While some leveraged borrowers have adjusted to the economic impact of COVID-19 and show signs of recovery, other borrowers with elevated leverage remain especially vulnerable.
7 The agencies continue to focus on assessing the impact of layered risks in leveraged lending transactions and the appropriateness of Credit risk management practices in adapting to the changing environment. Nonbank entities continue to participate in the leveraged lending market as these firms seek investor return via purchased Credit exposure. These nonbank entities hold a significant portion of non-pass leveraged commitments and non-investment grade3 equivalent leveraged term loans. By comparison, the SNC leveraged exposure held at banks is primarily comprised of investment grade equivalent revolving facilities. However, the agencies note that these investment preferences are not universal as some banks seek higher yields in the current low-rate environment.
8 Banks that originate and participate in leveraged lending transactions, and manage risks well, employ risk management processes that adhere to regulatory safety and soundness standards and adapt to changing economic conditions. In the current Credit environment, effective risk management processes have ensured that repayment capacity assessments are based on realistic assumptions of economic recovery and appropriately incorporate new debt that many borrowers added to build liquidity due to COVID-19 economic stress. Portfolio management and stress testing processes should consider that loss and recovery rates may differ from historical levels, and risks identified in stress tests should be measured against their potential impact on capital and earnings.
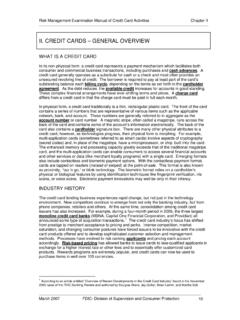
9 SNC Commitments: Volume, Credit Quality, and Trends Overall SNC Population The 2021 SNC population totaled $ trillion in commitments. Total commitments increased by $107 billion, or percent year-over-year, but growth has not caused any material shift in portfolio composition. While total commitments increased modestly, outstanding balances decreased percent as borrowers repaid advances on revolving facilities that were taken to supplement liquidity at the onset of the pandemic. The number of borrowers and facilities increased modestly again in 2021 (see exhibit 1). The agencies continue to select SNC transactions to review using a risk-based sampling approach, which in 2021 focused on bank-identified leveraged loans, special mention and classified loans, and loans to obligors in COVID-19 impacted industries, including CRE.
10 Asset quality measures and trends in the composition of SNC commitments by major 3 In this document, the terms "non-investment grade" and "investment grade" are based on bank-provided facility-level equivalent ratings. - 4 - industry group4 are provided in appendix C. Exhibit 1: Overall Credit Facilities and Commitment Trends Note: The decline in the number of SNC facilities between 2017 and 2018 mainly reflects the minimum commitment increase from $20 million to $100 million. Exhibit 2 details the year-over-year changes in aggregate SNC commitment amounts and reflects improvement in the level of special mention and classified SNC commitments. 4 T he agencies introduced industry data in 2008 that presented industries vertically along product origination and distribution lines.