Transcription of Sheet Series Leapfrog Hospital Safety Grades - advisory.com
1 Hospital Rankings Cheat Sheet Series Leapfrog Hospital Safety Grades Leapfrog releases its Hospital Safety Grades twice annually in the spring and fall Overview Leapfrog assigns ~2,600 general acute-care hospitals a latter grade from A through F in the spring, then updates these ratings in the fall when hospitals report newer data. Fall 2018 Distribution Grade Safety Grade Criteria Cut-Point Count of Hospitals Percentage of Hospitals A > 855 32%. B > 638 24%. C > 976 37%. D > 164 6%. F < 17 <1%. Eligibility Leapfrog considers all acute-care hospitals with sufficient publicly available data. They are unable to provide Grades for: Critical access hospitals;. Long-term care and rehabilitation facilities;. Mental health facilities;. Federal hospitals ( , VA hospitals);. Specialty hospitals and free-standing pediatric hospitals; and Hospitals that are missing data for more than six process/structural measures or more than five outcome measures. Data Collection Leapfrog uses 28 national performance measures to produce their composite Safety grade.
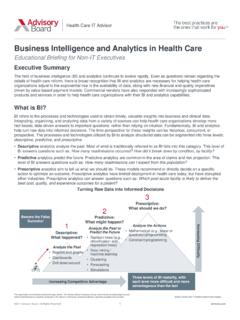
2 The data is collected from Leapfrog 's Hospital Survey as well as from CMS. When a Hospital doesn't have available data on a particular measure, Leapfrog uses secondary data from the American Hospital Association's Annual Survey or Health Care IT (HIT). supplement. For Maryland hospitals, they use data from the Maryland Hospital Commission. Leapfrog 's Annual Hospital Survey Leapfrog 's survey is free for hospitals to complete and is open from April 1 to December 31. It includes nine sections encompassing medication Safety , Safety practice adherence, response to serious errors, and staffing in the ICU/. surgical units. In January of each year, Leapfrog publishes a timeline of when they will pull the applicable data from their survey and from CMS. They also provide dates for a 3-week courtesy review, during which time hospitals can review the data that's been collected for accuracy and raise any concerns with Leapfrog 's help desk. Scoring Methodology Safety Grades measures are divided into two groups: process/structural measures and outcomes measures each of which account for 50% of the total score.
3 Process/structural Outcome Leapfrog grade measures measures November 2018 Source: The Leapfrog Group. Scoring Methodology. Web. 7. November 2018. The Leapfrog Group. Methodology Changes 2017 The advisory Board Company for Fall 2018 . Web. 7 November 2018. 1. Hospital Rankings Cheat Sheet Series Leapfrog Hospital Safety Grades Leapfrog releases its Hospital Safety Grades twice annually in the spring and fall Measures Leapfrog assesses hospitals' data on the 28 measures and calculates a z-score for each measure based on the Hospital 's data point and the measure's mean and standard deviation for all hospitals. Each measure's z-score is then multiplied by the weight assigned to that measure and totaled (plus ) to find each Hospital 's overall Safety Grade Score. This numerical score is then translated to a letter grade using the cut-offs outlined on the previous page. Measure Measure Overall Measures Included Group Weight Weight Process and Computerized Physician Order Entry (CPOE)* Structure (13) Bar Code Medication Administration (BCMA)** ICU Physician Staffing (IPS) Safe Practice 1: Leadership Structures and Systems Safe Practice 2: Culture Measurement, Feedback & Intervention Safe Practice 4: Identification and Mitigation of Risks and Hazards Safe Practice 9: Nursing Workforce 50%.
4 Safe Practice 19: Hand Hygiene H-COMP-1: Nurse H-COMP-2: Doctor Communication H-COMP-3: Staff Responsiveness H-COMP-5: Communication about Medicines H-COMP-6: Discharge Information Outcomes (15) Foreign Object Retained Air Embolism Falls and Trauma CLABSI (Central Line-associated Bloodstream Infection) CAUTI (Catheter-Associated UTI) SSI: Colon MRSA C. Diff 50%. PSI 3: Pressure Ulcer Rate PSI 4: Death Rate among Surgical Inpatients with Serious Treatable Conditions PSI 6: Iatrogenic Pneumothorax Rate PSI 11: Postoperative Respiratory Failure Rate PSI 12: Perioperative PE/DVT Rate PSI 14: Postoperative Wound Dehiscence Rate PSI 15: Unrecognized Abdominopelvic Accidental Puncture/Laceration Rate *Scoring methodology changed for fall 2018; **Measure added fall 2018. Source: The Leapfrog Group. Scoring Methodology. Web. 7 November November 2018 2018. The Leapfrog Group. Methodology Changes for Fall 2018 . Web. 7 November 2018. 2017 The advisory Board Company 2