Transcription of Shi-Tao Yeh, GlaxoSmithKline, King of Prussia, PA
1 ABSTRACTThe results of all safety-related laboratory tests arecollected in clinical trial studies. A shift table is a tablethat displays the number of subjects who are low,normal, or high at baseline and the shift or transition atselected time points or time table provides key information about the health andwelfare of the subjects during the clinical paper provides a comprehensive, flexible, andmodular SAS reporting approach for producing alaboratory shift SAS product used in this paper is SAS BASE onUNIX clinical trial study collects all safety-related clinicallaboratory (Lab) tests for safety analysis. SASprogrammers in the clinical study team support theclinical data analysis and reporting of the more frequently requested reports is the LabShift Table (LST).
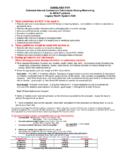
2 It is a clinical report that summarizesthe number of subjects who are low, normal, or highatFigure 1 Sample Output from Programbaseline and then at selected time points or timeintervals. In other words, it displays Lab value transitionswith respect to normal range and clinical concern levelcategories from a baseline period to a specific on-therapyvisit vendor who performs the laboratory test usuallyprovides normal range for numeric Lab parameters. Theclinician may specify clinical concern level for the study team uses a 'Lab Flagging' program to flag theLab records to see whether it is above or below theconcern are several types of LST presentation formats andlayout.
3 Figure 1 shows the LST layout that is adopted byGlaxoSmithKline as standard LST FLAGGINGP rior to summarization, the raw data from a clinicallaboratory require Lab Flagging. Lab flagging is aprocess that marks each laboratory record in thedatabase using parameter specific clinical criteria. Thecriteria often include: 1) values are outside of thesupplied normal range, 2) values are high or low enoughto cause clinical concern, 3) values have increased ordecreased by a specified amount to cause clinicalconcern. There are three flags from this flagging process:1) normal range flag, 2) shift from baseline flag, and 3)clinical concern flag.
4 Each flag may contain the symbols:A SAS MACRO FOR PRODUCING CLINICAL LABORATORY SHIFT TABLE Shi-Tao Yeh, GlaxoSmithKline, King of Prussia, PAH for above the range, L for below the range, and I forwithin the the illustration purposes, the Lab flagging criteria andflags are converted to the following symbols and labelson the report:SymbolLabelDescription+RR Highabove high value ofclinical concernHNR Highabove high value of normalrangeIW/in NRwithin normal rangeLNR Lowbelow low value of normalrange-RR Lowbelow low value of clinicalconcernLST is presented in a matrix format, shown in Figure first column is the visit or time interval label.
5 Thesecond column is n which is the total subjects for eachvisit or time interval. A subject must have both baselineand target visit/interval test values to be counted in baseline flagged values are shown in rows of thematrix and target visit or interval flagged values areshown in columns. Each cell represents a shift from aspecific baseline flagged category to a specific targetvisit flagged category. The LST also provides thepercentage for each cell. The percentage of the value ina single cell is the count of the cell divided by a user selects time interval with multiple visits,the worst case test value or the last test value carriedforward can be selected for each paper presents a novel and comprehensiveapproach that is simple, efficient, and produces a readilyinterpretable transition presentation in the LST.
6 Theapproach consists of several SAS macros, and it isdiscussed in the following sections. The sample SAScodes are shown in Appendix 1: SET INITIATION AND ENVIRONMENTVARIABLESThe first step sets up macro variables, computingenvironment variables, and formats used for reporting theLST. The input parameters for this macro are as follows:PARAMETERDESCRIPTION datasetthe input dataset namenoprintvno print variable which controls theorder of displaybyvarsa categorical variable list for page byvariables that appeared in the displaybyfmtsformat name for byvarspidvarsdefault=usubjid, subject variable namecolvara variable name for the first column inthe displaycolfmtformat name for colvarbaseflagdefault=R, flag for baseline recordscellindxdefault=labshift, cell index datasetnameSTEP 2.
7 SET UP REPORTING MAIN PROGRAMThe main reporting program completes a number ofrelatively generic steps in the ) assign the number of lab parameters and by groupvariables to loop index variables2) subset valid lab flag values from the data3) separate baseline and other visits4) convert flagging values to the formatted symbols tobe displayed on the matrix5) merge the baseline records into the other visitrecords6) count the number of subjects in each matrix cell andthe total denominators7) compute the cell percentages8) determine which parameters do not have clinicalconcern flags and blank out the clinical concern rowsfor these pagesSTEP 3: CREATE A REPORTING MODULEThe reporting module produces a matrix page of outputfor each laboratory parameter and by group 4: CREATE A CELL INDEX MODULEThe final step produces an optional cell index toprovide the detailed laboratory data that compriseeach 5: CREATE SASMAN PROGRAMThe SASMAN program is a protocol-specific module thatallows the other modules of the LST program to remainrelatively generic.
8 It is also the data preparation stepbefore invoking the LST macro. The SASMAN moduleincreases the flexibility of the LST software by performingthe following tasks:1) read in the flagged Lab dataset,2) make any required data subset selection,3) select the target Lab variable list,4) define the column variables and baseline variablesin the LST and feed-in dataset,5) select the last value or worst case based onprotocol-specific requirements,6) use data steps to prepare dataset to be feed in tomain SAMPLE CODEThe following sample code is an example of SASMAN program before calling the LST format; value labses 2 = 'BASELINE' 8 = 'WEEK 8' 9 = 'FOLLOW-UP' ;data lab.
9 Set ; lbstxrhi = lborxrhi; lbstxrlo = lborxrlo; lab_parm = trim(left(lbtest)) || '(' ||trim(left(lbstunit)) || ')'; if visitnum = 1 and lbflag='B' thenvisitnum=2; if visitnum=15 then visitnum=9; if visitnum=1 or (visitnum = 2 and lbflag= 'U' ) or trtcd=1 then delete; if visitnum in (2,8,9); keep lbnrcd lbxrcd lborres lbstresnlbflag usubjid subjid lbtest lbtestcdlbstunit lbstxrhi lbstxrlo visit visitnumtrtcd trtgrp lab_parm;data dem; set ; if trtcd = 1 then delete; keep usubjid; proc sort;by usubjid; data final; set lab; vorder = visitnum; label lab_parm = 'Test' trtgrp = 'Treatment';proc sort;by usubjid;data final; merge dem(in=a) final; by usubjid; if a; %rstart(driver= ,rptdir=$_list, suffix=a, outfile=lb_4); options ls=90 ps=31 missing=' ' nobyline; %inc ' '; %lbsf1(dataset=final, noprintv=vorder, byvars = lab_parm trtgrp, colvar = visitnum, baseflag = B, cellindx = labshift, colfmt = labses );%rstop; run; proc datasets; delete final lab; run;SAMPLE OUTPUTSTwo sample pages of output are presented.
10 Thefirst page, shown in Figure 1, represents alaboratory parameter for which normal range andclinical concern criteria were specified. The secondsample page in Figure 2, represents a laboratoryparameter for which only clinical concern criteriawere 2. Sample OutputCONCLUSIONSThis LST approach provides a framework that is simple,comprehensive, efficient, and produces a readilyinterpretable transition presentation in the LST. Thismodular design makes the best use of the SAS systemcapability of providing robust generic code, andcustomizable data processing summary, this approach*Provides a framework for the rapiddevelopment and modification of a LSTprogram.