Transcription of Shifting, Reflecting and Stretching Graphs
1 PreCalculus Generic Notes By Scott Surgent shifting , Reflecting and Stretching Graphs We begin this lesson with a summary of common Graphs that we have seen thus far. We have already had experience with constant and linear functions, and have been introduced, albeit sparingly, to the other Graphs . Nevertheless, these are very common functions and it is necessary to be able to recognize them by sight. For example, we know that linear functions of the form bmxxf+=)( all have one common feature: Their Graphs are lines. Instead of tediously plotting points to generate a graph , we use the fact that this graph has a slope m and a y-intercept of b. These bits of information serve as convenient shortcuts toward plotting a line. We will use similar ideas with more complex Graphs .
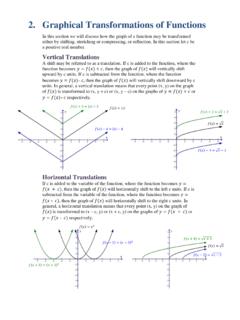
2 One of the simplest Graphs is the parabola . On your calculator, enter this function in your function editor. graph it on the standard window. Now type in the function and graph it. You will notice that this graph is exactly the same as the first graph , only in a different location. In particular, each y-value from the original function has been increased by 2 in the new function. Hence, the effect of the +2 was to shift the original graph up two units. This is an example of a vertical shift. What do you think the graph of looks like? 2xy=22+=xy42 =xy Clear out your Graphs except for the graph (we keep this one on the screen for comparison purposes). Now type in this function:, and graph it. This graph is the original graph now shifted to the right two units.
3 This may be counterintuitive, but try this: If you set , you will note that 2xy=2)2( =xy2=x0=y. The x-intercept is at (2,0), shifted two units to the right from the original graph . This is a horizontal shift. We summarize: Given any function , )(xfy= a) represents a vertical shift of f(x), that is, the original graph has been shifted up or down c units. Specifically, up c units if c is positive, down c units if c is negative. cxfy+=)( b) represents a horizontal shift of f(x). )(cxfy+=)(cxf+ shifts c units to the left if c is positive, or c units to the right if c is negative. You will have to train your mind to remember that the horizontal shift is opposite the sign in front of the c. Note: it is common to use the letter k for vertical shifts and the letter h for horizontal shifts.
4 Therefore, it is easy to read the expression khxf+ )( as the function f(x) shifted h units left or right, and k units up or down. Also, the negative in front of the h PreCalculus Generic Notes By Scott Surgent lends an intuitive sense to the expression. For example, 3)2(+ xf means the function has been shifted 2 units to the right, or read as )2( x, and 3 units down. Now go back to your calculator and enter and , and graph them. You will notice the second function is reflected across the x-axis, although the shape of the original graph has not changed. In general, given a function 2xy=2xy =)(xfy=, its horizontal reflection across the x-axis is found by negating the entire function, or . Its vertical reflection across the y-axis is found by negating the input value before evaluating, or.
5 (xfy =)(xfy = These two reflections can be combined as such: )(xfy =, in which both reflections take place. This has the same effect as turning the graph upside down from its original position, or literally, turning your sheet of paper 180 degrees. Reflections and shifts are called rigid transformations since they do not change the shape of the original graph , only its location and orientation. A non-rigid transformation changes the shape of the original graph , and an example of a non-rigid transformation is found by multiplying the original function by a constant (but not 0). Experiment on your grapher by graphing , and . The effect of the coefficient 2 in the second graph is to stretch the original graph upwards, making it appear taller, while the coefficient shrinks the original graph , making it appear squatter (or, equivalently, stretches it in the horizontal direction).)
6 2xy=22xy= Remember, the purpose of shifts, reflections and stretches/shrinks is to aid you in graphing functions. You should not have to plot many points at all. You should be able to determine the function s basic shape and then apply these transformations to the graph to arrive at your answer. Combinations of Functions We discuss the arithmetic of functions. Given two functions and , you can add, subtract, multiply and divide these functions as you please, as long as you follow sound algebra techniques. Also note the convenience of using function notation. We can write the sum of and as a new function whose name is and written . )(xf)(xg)(xf)(xggf+))((xgf+ When performing division, please note which values of x cannot be used, and restrict your domain accordingly.
7 Composition of functions, is an extremely important operation of functions. Given two functions and, we can create the new function , which reads function f evaluated at g(x) . You are literally inserting g(x) into the variable x in the function f(x). The new function is often referred to as f comp g . )(xf)(xg))(())((xgfxgf=o PreCalculus Generic Notes By Scott Surgent Normally, and are not equal. We will see in the next section that composition is a useful tool for determining whether two functions are inverses of one another. Study the algebra involved in simplifying these expressions, and be especially cognizant of the meaning of the variables, and of the final composition function. ))((xgfo))((xfgo Generally, you should find the resulting composition function first before evaluating at a value of x.
8 For example, if you were asked to evaluate , you would want to find first, then insert the 3. Composition simply requires practice. )3)((gfo))((xgfo Inverse Functions Lastly, we discuss the inverse of a function. Intuitively, the inverse undoes the actions of. Suppose. Then, generates points such as (1,3), (2,4), (3,5), among many possibilities, simply by arbitrarily picking an x-value, and evaluating for its corresponding y The inverse of would consist of the points (3,1), (4,2), (5,3), or the transpose of any point found by . For now, we will denote the inverse of a function by the notation , read as f-inverse . )(xf2)(+=xxf)(xf)(xf)(xf)(xf)(1xf We need to discuss many facets regarding inverse functions. First, let us discuss the inverse Graphs of functions.
9 Since the inverse graph switches the order of the x and y values in each coordinate, the inverse graph appears as a mirror image across the 45-degree line. However, some inverse Graphs are not functions themselves. Let us discuss the conditions for the existence of an inverse function. Let us consider . As an example, generates points such as (2,4) and (-2,4). The inverse of would contain the points (4,2) and (4,-2). However, the inverse graph would NOT be a function, since the input value of 4 returns two output values for y, and this is NOT allowed for a function! Therefore, does not have an inverse function. A graph of shows that there are y-values that have more than one x-value corresponding to it.
10 This is acceptable, but when we reverse the order of the coordinates, this produces a graph that fails the VLT. 2)(xxf=)(xf)(xf2)(xxf=2)(xxf= The horizontal line test (HLT) is a visual test in which you visualize horizontal lines over the graph of . If there exists a horizontal line that intersects the graph more than once, then the inverse function will not exist. On the other hand, if no horizontal line intersects the graph more than once, the graph of passes the HLT, and is said to be one-to-one, and the inverse function exists. See page 149 for examples of the use of the HLT. )(xf)(xf)(xf)(1xf PreCalculus Generic Notes By Scott Surgent To verify whether two functions are inverses, form the composition of the two functions.