Transcription of Simple Linear Regression Model and Parameter Estimation
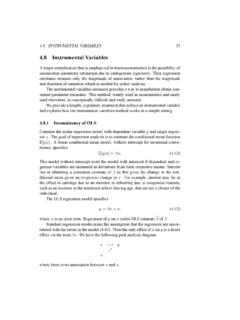
1 Simple Linear Regression Model and Parameter Estimation Reading: Section and Learning Objectives: Students should be able to: Understand the assumptions of a Regression Model Correctly interpret the parameters of a Regression Model Estimate the parameters of a Regression Model 1. Simple Regression Analysis Regression analysis deals with investigation of the non- deterministic relationship between two (or more). variables. Simple Linear Regression Model : non-deterministic Linear relationship between two variables. 2. Fixed Predictor and Random Response Variable For a fixed value of x, the value of Y is random, varying around a mean value determined by x. x variable: independent / predictor / explanatory variable Y variable: dependent / response variable 3.
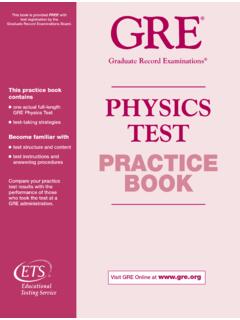
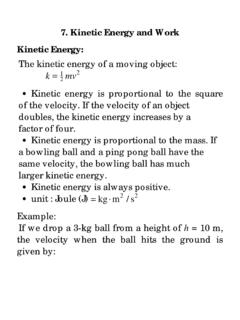
2 Scatter Plot - Checking Linear Relationship Example: Relationship between diesel oil consumption rates measured by two methods Pairwise data (x1,y1), (x2, y2), , (xn, yn). x y x- rate measured by drain-weigh method 4 5. 5 7 Y-rate measured by CI-trace method 8 10. 11 10. 12 14. 16 15. 17 13. 20 25. 22 20. 28 24. 30 31. 31 28. 39 39 4. Simple Linear Regression Model & Interpretation Regression Model Regression line 5. Example: Relationship between diesel oil consumption rates measured by two methods x y x- rate measured by drain-weigh method 4 5. 5 7. Y-rate measured by CI-trace method 8 10. 11 10. 12 14. 16 15. 17 13. 20 25. 22 20. 28 24. 30 31. 31 28. 39 39. 6. Example: Relationship between diesel oil consumption rates measured by two methods Regression line ( estimates of Regression Model ).
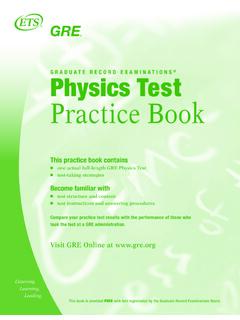
3 (1) What is the distribution of Y when x = 10? (2) What is the probability that Y is greater than 10 when x = 10? 7. 8. Example: Relationship between diesel oil consumption rates measured by two methods (3) Let Y1 and Y2 be the independent rates measured by the CI trace method corresponding to x1 = 10 and x2 = 11, respectively. What is the probability that Y1 and Y2 differ by more than 5? 9. 10. Error sum of squares (SSE). Data Model Prediction Error (from a line). Error sum of squares (SSE). 11. LS estimates of Model parameters Least squares (LS) Estimation estimates Regression parameters by minimizing SSE. The resulting line is called the Regression line 12. LS estimates of Slope and Intercept LS estimate of intercept b y x 0 0 1.
4 LS estimate of slope b1 1 . ( x x )( y y ) x y ( x )( y ) / n i i i i i i (x x). i 2. x ( x ) / n 2. i i 2.. 13. LS estimates of Variance 2. Fitted values Residuals Error sum of squares (SSE). 14. Example: Relationship between diesel oil consumption rates measured by two methods x y 4 5. 5 7. 8 10. 11 10. 12 14. 16 15. 17 13. 20 25. 22 20. 28 24. 30 31. 31 28. 15. 39 39. Example: Relationship between diesel oil consumption rates measured by two methods x y Y-hat e-hat 4 5. 5 7. 8 10. 11 10. 12 14. 16 15. 17 13. 20 25. 22 20. 28 24. 30 31. 31 28. 16. 39 39. Coefficient of Determination (r2). How much of the variability in Y can be explained by its relationship with x? If x and Y are perfectly correlated , then 100%.
5 Can be explained by the relationship. The tighter the relationship, the larger the portion of variability explained. 17. Coefficient of Determination (r2). Total sum of squares (SST) and Error Sum of Squares (SSE). SSE is smaller than SST, but how much smaller? Percent reduction in error = coefficient of determination 18. Example: Relationship between diesel oil consumption rates measured by two methods The Regression equation is: y = + x Predictor Coef SE Coef T P. Constant x S = R-Sq = R-Sq(adj) = Analysis of Variance Source DF SS MS F P. Regression 1 Residual Error 11 Total 12 19. Regression Effect Regression toward mediocrity pulled back in toward the mean Upper half will still be in the upper half but not by as much (from the mean).
6 Lower half will still be in the lower half but not by as much (from the mean). 20.