Transcription of Small Cap Value - The Timothy Plan
1 VOLATILITYWEIGHTEDCYCLICAL7%Basic Materials10%Consumer Cyclical18%Financial Services7%Real EstateSENSITIVE2%Communication ServicesYTD6%Energy14%IndustrialsClass A1 C1 I2 Defensive sales charges4%Utilities Equivalents0%Fixed12%ETFsHostess Brands Systems USA, in the Box Industrial REIT, Bancorp Solutions Global Infrastructure Inc.$27,85602/02 sales year 3 year 5 year 10 yearSIRussell 2000 Index A1 PERFORMANCE DOES NOT GUARANTEE FUTURE RESULTS. Investment return and principal Value of an investment will fluctuate; therefore, an investor's shares, when redeemed, may be worth more or less than their orginal cost.
2 Current performance may be higher or lower than the performance data quoted. Visit for the most recent month end Russell 2000 Index tracks the performance of 2,000 of the smallest companies, based on market capitalization. The Index assumes reinvestment of all dividends and distributions and does not reflect any asset based charges for investment management or other expenses. It is not possible to invest directly in an illustration is based on a hypothetical $10,000 investment in A Class shares. All results shown assume reinvestment of dividends and capital gains. The maximum sales load on Class A shares is ; the maximum CDSC on Class C shares is 1%; Class I shares are no load shares which are available exclusively through registered investment advisors or for institutional accounts.
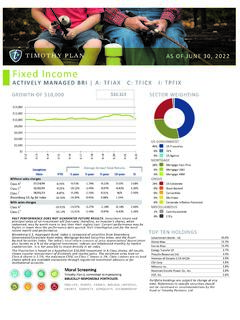
3 AS OF MARCH 31, 2022 SECTOR WEIGHTINGGROWTH OF $10,000 TOP TEN EQUITY HOLDINGSS mall Cap ValueACTIVELY MANAGED BRI | A: TPLNX C: TSVCX I: TPVIXP ortfolio holdings are subject to change at any time. References to specific securities should not be construed as recommendations by the fund or Timothy Partners, Ltd. Moral ScreeningTimothy Plan is committed to maintainingBIBLICALLY RESPONSIBLE LIFE, PURITY, FAMILY, BIBLICAL LIFESTYLE,LIBERTY, SOBRIETY, LONGEVITY, STEWARDSHIP$0$5,000$10,000$15,000$20,000 $25,000$30,000$35,0003 123 133 143 153 163 173 183 193 203 213 22 Average Annual Total ReturnsVOLATILITYWEIGHTEDFirm:Westwood Management :Since 1982 Assets (as of prior quarter):$ bilInception with Timothy Plan:Firm: Timothy Partners, Style: Small Cap ValueTotal Net Assets:$ milEXPENSES (%)GrossFee Waiver 4 NetPrice/Earnings Ratio:Average Mkt Cap.
4 (wtd):Price to Book:Est. Forward Growth:BenchmarkRussell 2000 IndexCALENDAR YEAR RETURNS202120202019 I x$ bil$ reduce shareholder expenses, a voluntary fee waiver has been applied to a portion of the Advisor's management fee. I 2CA01/01/06 PORTFOLIO MANAGEMENTMUTUAL fund CHARACTERISTICS 3[ETF SLEEVE] Sub AdvisorWestwood Management Corp. is a wholly owned subsidiary of Westwood Holdings Group, Inc., a publicly traded company (NYSE:WHG). Westwood is a Registered Investment Advisory Firm. Westwood utilizes a team of investment professionals, who are responsible for the day to day recommendations regarding the investment of the investment objective of this fund is to provide you with long term growth of capital, with a secondary objective of current The fund seeks to achieve its investment objective by primarily investing at least 80% of the fund s total assets in stocks with market capitalizations that fall within the range of companies included in the Russell 2000 Index (the Index ).
5 In determining whether to invest in a particular company, the fund s Investment Manager focuses on a number of different attributes of the company, including the company s market expertise, balance sheet, improving return on equity, price to earnings ratios, industry position and strength, management, and a number of other factors. The fund may invest in equity securities of foreign issuers in the form of American Depositary Receipts (ADRs).CAREFULLY CONSIDER THE INVESTMENT OBJECTIVES, RISKS, CHARGES, AND EXPENSES BEFORE INVESTING. A PROSPECTUS IS AVAILABLE FROM THE fund BY CALLING , VISITING , OR YOUR FINANCIAL PROFESSIONAL THAT CONTAINS THIS AND OTHER MORE COMPLETE, IMPORTANT INFORMATION.
6 PLEASE READ IT CAREFULLY BEFORE INVESTING OR SENDING MONEY. 1 The returns shown for periods prior to the share class inception date (including returns since inception, which are since fund inception) include the returns of the fund s oldest share class. These returns are adjusted to reflect any higher class related operating expenses of the newer share classes, as applicable. For more information please visit: investment products/mutual funds/appended I SHARES can only be purchased through a Registered Investment Advsior or by an Institution for its own account. The Class I Share prospectus is available from the include Sub Advisor's Numbers reflect the expense ratios disclosed in the Trust s most recent prospectus and do not include deemed expenses due to Acquired Funds Fees and Expenses.
7 Voluntary Advisor Fee Waivers vary and are also reflected in the most recent Audited Annual and Unaudited Semi Annual Reports. The voluntary fee waiver may be revised or terminated at any time without SEE THE fund PROSPECTUS FOR A COMPLETE EXPLANATION OF THE RISKS INVOLVED WITH EACH fund . Risk chart is for illustrative purposes OF MARCH 31, 2022 Small Cap ValueACTIVELY MANAGED BRI | A: TPLNX C: TSVCX I: TPVIXPast performance does not guarantee future results. The performance data quoted represents past performance and current returns may be lower or higher. The investment return and principal Value will fluctuate so that an investor s shares, when redeemed, may be worth more or less than the original cost.
8 To obtain performance information current to the most recent month end, please call the fund at Materials4%Consumer Cyclical7%Financial Services5%Real EstateSENSITIVE1%Communication ServicesYTD6%Energy13%IndustrialsClass A1 C1 I2 Defensive sales charges4%Utilities Equivalents0%Fixed23%ETFsGeneral Dynamics & Co., Pacific Corp,WEC Energy Group, Supply Castle International International Corp.$30,082 InceptionWithout sales charges07/14 year 3 year 5 year 10 500 PERFORMANCE DOES NOT GUARANTEE FUTURE RESULTS. Investment return and principal Value of an investment will fluctuate; therefore, an investor's shares, when redeemed, may be worth more or less than their orginal cost.
9 Current performance may be higher or lower than the performance data quoted. Visit for the most recent month end S&P 500 Index is a widely recognized, unmanaged index of common stock prices. The Index assumes reinvestment of all dividends and distributions and does not reflect any asset based charges for investment management or other expenses. It is not possible to invest directly in an index. The illustration is based on a hypothetical $10,000 investment in A Class shares. All results shown assume reinvestment of dividends and capital gains. The maximum sales load on Class A shares is ; the maximum CDSC on Class C shares is 1%; Class I shares are no load shares which are available exclusively through registered investment advisors or for institutional accounts.
10 AS OF MARCH 31, 2022 SECTOR WEIGHTINGGROWTH OF $10,000 TOP TEN EQUITY HOLDINGSL arge / Mid Cap ValueACTIVELY MANAGED BRI | A: TLVAX C: TLVCX I: TMVIXP ortfolio holdings are subject to change at any time. References to specific securities should not be construed as recommendations by the fund or Timothy Partners, Ltd. Moral ScreeningTimothy Plan is committed to maintainingBIBLICALLY RESPONSIBLE LIFE, PURITY, FAMILY, BIBLICAL LIFESTYLE,LIBERTY, SOBRIETY, LONGEVITY, STEWARDSHIP$0$5,000$10,000$15,000$20,000 $25,000$30,000$35,0003 123 133 143 153 163 173 183 193 203 213 22 Average Annual Total ReturnsVOLATILITYWEIGHTEDFirm:Westwood Management :Since 1982 Assets (as of prior quarter):$ bilInception with Timothy Plan:Firm: Timothy Partners, Style:Large/Mid Cap ValueTotal Net Assets:$ milEXPENSES (%)GrossFee Waiver 4 NetPrice/Earnings Ratio:Average Mkt Cap.


