Transcription of Smoking statistics - Action on Smoking and Health
1 Number of adult smokersThe highest recorded level of Smoking among men in Great Britain was 82% in 1948, of whom 65% smoked manufactured cigarettes. At that time, significant numbers of men smoked pipes or cigars as well as, or instead of, manufactured cigarettes. By contrast, women have tended to smoke only cigarettes. Smoking prevalence among women in 1948 was 41% and remained fairly constant until the early 1970 s, peaking at 45% in the mid 1960 the proportion of adults (aged 16 and over) Smoking in Great Britian has been declining since 1974 when national surveys on Smoking first began.
2 The fastest decline was in the 1970s and 1980s. Since then Smoking has continued to decline but at a slower Prevalence of cigarette Smoking by sex, 1974 to 2014, Great Britain 2 3%19741978198219861990199419982002200620 1020132014 Men514538353128282723212220 Women413733312926262521201717 All454035333027272622201919NB: Since 2000 data have been weighted. Since 2012 figures are from the Opinions & Lifestyle Survey; previous data are from the General Household/General Lifestyle Surveys. There are about million adult cigarette smokers in Great Britain and the number of ex-smokers exceeds that of smokers.
3 The proportion of the population who have never smoked has increased from 37% in 1974 to 59% in 2014. In addition, the proportion of cigarette smokers who have quit doubled between 1974 and 2014 from 27% to 55%.2 Since 1990 there has been a steady increase in the number of smokers using mainly hand-rolled tobacco. In 1990, 18% of male smokers and 2% of female smokers said they smoked mainly hand-rolled cigarettes but by 2011 this had risen to 40% and 26% The 2014 Opinions & Lifestyle survey revealed that 39% of male and 28% of female smokers said they smoked hand-rolled Measuring Smoking ratesPeriodically the Government sets targets to reduce Smoking prevalence in the population.
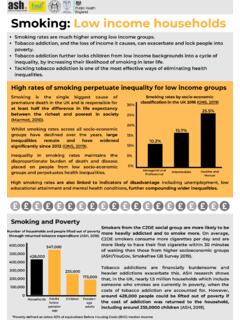
4 In the 1998 White Paper Smoking kills the Government set a target to reduce adult Smoking rates to 21% or less by 2010, with a reduction in prevalence among routine and manual groups to 26% or The target for the general population was achieved by 2007 but not for lower socio-economic groups (28% in 2011). In its strategy paper launched on 1 February 2010 the Labour Government set new targets to reduce Smoking among the general population to 10% of adults and to 1% or less among children by In March 2011 the Coalition Government launched its Tobacco Control Plan Smoking statistics who smokes and how muchASH Fact Sheet on: Smoking statistics February 2016 Planned review date: Aug 20161 ASH Fact Sheet on.
5 Smoking statisticsfor England in which it set out ambitions to reduce adult Smoking prevalence to or less by 2015 and to reduce Smoking among 15 year-olds to 12% or less by Cigarette Smoking by gender and ageAcross all age groups men are more likely to smoke than women. In 2014 20% of men aged 16 and over smoked compared with 17% of women. Smoking prevalence is highest among young adults: 23% of those aged 16-24 and 24% among the 25-34 age group. Smoking continues to be lowest among people aged 60 and over. Although they are more likely than younger people to have ever been smokers, they are more likely to have stopped Smoking .
6 Cigarette Smoking by age percentage of adult population 2 3 Age%16-19*20-24*25-3435-4950-5960+197440 4851525134198431384039393019942739323027 1720042432312924142014202624211911*Due to small sample sizes, these figures should be treated with caution. Number of secondary school children in England who smokeVery few children are smokers when they start secondary school: among 11 year olds fewer than are regular smokers. The likelihood of Smoking increases with age so that by 15 years of age 8% of pupils are regular Among children who try Smoking cigarettes between one third and one half will go on to become regular smokers within two to three , the prevalence of regular Smoking among children aged 11-15 remained stable at between 9% and 11% from 1998 until 2006.
7 However, in 2007 there was a fall in overall prevalence from 9% to 6%, the lowest rate recorded since surveys of pupils Smoking began in 1982. The downward trend has continued: in 2013 and 2014 overall prevalence was 3% and among 15 year olds it fell to 8%.7 For further information see ASH Fact Sheet on Young People and Smoking (pdf) Percentage of pupils aged 15 who are regular smokers (at least one cigarette per week on average), England 7198219861990199419982002200620102012201 32014 Boys24182526192016101086 Girls25272530292624141089 All25222528232320121088 Cigarette Smoking and socio-economic groupThere is a strong link between cigarette Smoking and socio-economic group.
8 In 2014, 30% of adults in routine and manual occupations smoked compared to 13% in managerial and professional Fact Sheet on: Smoking statisticsPrevalence of cigarette Smoking by socio-economic classification Persons aged 16 and over. Great Britain: 2014 (%) 2 MenWomenTotalLarge employers and higher managerial91611 Higher professional 1149 Lower managerial and professional171215 Intermediate201818 Small employers / own account222022 Lower supervisory and technical353435 Semi-routine312930 Routine282928 Historically there has been a slower decline in Smoking among manual groups, resulting in Smoking becoming increasingly concentrated in this population.
9 In recent years, Smoking rates have fallen by a similar amount across all social groups, so that the differential between non-manual and manual has not changed 2011 the ONS Lifestyle surveys included questions about the age at which people started to smoke. (This information is not collected in the OPN survey.) As in previous surveys, the 2011 data revealed an association between socio-economic group and the age at which people started to smoke. Of those in the managerial and professional households, 31% had started Smoking before they were 16, compared with 45% of those in routine and manual Tobacco consumptionSince the mid 1970s cigarette consumption has fallen among both men and women, particularly among heavy smokers (defined as those Smoking more than 20 cigarettes a day).
10 In 1974, 26% of men and 13% of women were heavy smokers compared to 5% of men and 3% of women in 2012. The average number of cigarettes smoked per day by men and women has decreased across all age groups. Average daily consumption of manufactured cigarettes per smoker, 1949-20141, 2 ,3 is an association between consumption and socio-economic group. A YouGov survey comissioned by ASH found that 55% of current smokers in higher social groups (AB) smoked 10 or fewer cigarettes per day compared to 34% in the lowest social group (E). People in the lowest social group are more likely to be heavy smokers: 18% reported Smoking 21 to 30 cigarettes a day compared to 9% in the highest social The findings are in line with previous ONS reports.