Transcription of SOLAR REPORT - Australian Energy Council
1 SOLAR REPORT MARCH 2016 Australian Energy Council DD MM YYYY Australian Energy Council Level 14, 50 Market Street, Melbourne VIC 3000 SOLAR REPORT MARCH 2017 Australian Energy Council 2 2 Table of contents STATE OF SOLAR PV IN AUSTRALIA ..3 LOWER INSTALLATION NUMBERS, BIGGER SYSTEM SCALE ..6 ESTIMATED RESIDENTIAL PV GENERATION .. 10 LEVELISED COST OF Energy .. 11 PAYBACK PERIOD, DETAILED MODEL .. 14 SOLAR NEWS ROUND UP .. 16 METHODOLOGY APPENDIX .. 17 1. SOLAR installations methodology .. 17 2. Levelised Cost of Electricity Methodology .. 17 3. Payback period methodology .. 19 3 3 STATE OF SOLAR PV IN AUSTRALIA While the trend for SOLAR photovoltaic (PV) system installations since January 2016 has remained fairly flat and January 2017 saw a slight decrease in installations, the monthly average unit size has been increasing and reached 6 kilowatts at the end of last year (compared to kW in January 2016 ).
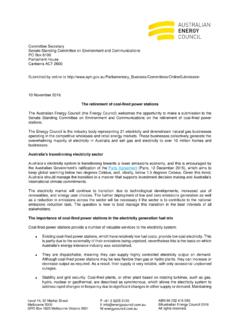
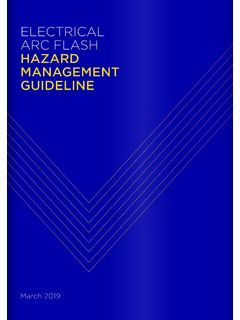
2 Cumulative installed capacity for SOLAR PV in Australia stood at 5500 MW with more than million installations at February 2017. Figure 1 shows the monthly data for SOLAR PV installations since 2012. There has been a reasonably consistent number of installations since December 2014, and this has ranged from 11,500 to 12,500 installations each month. It is interesting to see that although the number of installations remains fairly flat, the monthly average unit size is in fact going upward at a faster rate and reached more than 6 kilowatts by the end of 2016 . That is at least a 15 per cent jump compared to the previous month. It is worth nothing that because SOLAR PV system owners have up to 12 months to REPORT their data to the Clean Energy Regulator, the reported data for the most recent months is likely to understate the number of actual installations as well as the installed capacity.
3 Figure 1: monthly installations, installed SOLAR PV capacity and average system size Jan 2012 - 2017 Source: Clean Energy Regulator (adjusted data), Energy Council s analysis, March 2017 In terms of SOLAR capacity, our calculation (based on previous trends in the data) suggests that the December and January figures will rise 12 and 27 per cent respectively, bringing the total added capacity for December to of installed capacity and for January across Australia. While the figures for January currently may appear as an outlier, January traditionally has been the softest month each year for SOLAR PV installations so the most recent figures reflect this trend.
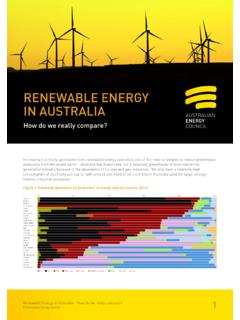
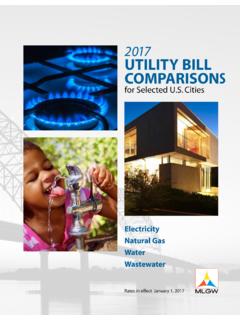
4 4 4 In a number of major state markets, SOLAR growth rates are continuing to slow down. Figure 2 shows the proportion of each month s number of SOLAR PV installations by state from March 2015 to February 2017. South Australia and Victoria show an increasing trend in SOLAR PV installations in recent months and accounted for nearly 60 per cent of total installations. Queensland continues to lead the states for the greatest proportion of households with SOLAR PV installed. The installation rate in Queensland ha however been lower in the recent months. The state s monthly installed capacity still remains at the top, and accounted for more than 30 per cent of total installed capacity with 1994 systems installed to date in February (figure 3).
5 As mentioned earlier, these recent data will be subject to revision due to the lag in the CER data. Figure 2: Proportion of monthly SOLAR PV installation numbers by stateSource: Clean Energy Regulator (adjusted data), Energy Council s analysis, March 2017 5 Figure 3: Proportion of monthly installed SOLAR PV capacity by state Note: The Northern Territory and the ACT have been excluded, due to their small population size. Source: Clean Energy Regulator (adjusted data), Energy Council s analysis, March 2017 2016 FebMarAprMayJunJulAugSepOctNovDecJan 2017 FebWAVICTASSAQLDNSW6 6 LOWER INSTALLATION NUMBERS, BIGGER SYSTEM SCALE Since the announcement of the closure of the Hazelwood power station closure in November last year, there has been a rise in electricity prices.
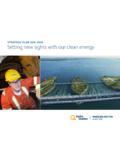
6 This coincides with an increase in the number of rooftop SOLAR PV systems installed, having peaked in December 2016 following the drop in December 2014 (see figure 1). Although there is a downward trend for SOLAR PV systems installations, the average capacity of units is trending upward. To better understand the adoption pattern of different unit sizes, figure 4 shows the number of SOLAR PV installations at varying system size ranges. Grouping the installed panels into different size ranges in each calendar month reveals a clear trend towards the installation of larger systems. The early adoption of small SOLAR panels of less than kW was the greatest in June 2011, accounting for per cent of total installations for the month.
7 It was stated that up until mid-2012, the most popular SOLAR system size sold in Australia was the kW system. The reason being is that the SOLAR rebate at and before that time was generous, where a multiplier was placed on the number of small-scaled technology certificates that can be created for the first kW of SOLAR installedi. Figure 4: monthly installations by size category Source: Australian PV Institute (APVI) SOLAR Map, 2016 The number of systems with less than kW in capacity has been declining, having been replaced by bigger systems (up to kW) from early 2013. The percentage of larger SOLAR PV systems installed has continued to grow (see table 1).
8 The average installed system size is currently between to kW, and these represent per cent of total installations. The number of systems with 7 7 a capacity of less than kW has dropped significantly and accounted for around per cent of total installations at June 2016 , equivalent to the total number of installed system units s greater than kW in size. Table 1: The percentage of number of installations of different unit size in June since 2011 < kW kW kW kW 14-25 kW 25+ kW Jun-11 Jun-12 Jun-13 Jun-14 Jun-15 Jun-16 Source: Australian PV Institute (APVI) SOLAR Map, Australian Energy Council analysis, 2016 What are the causes?
9 Australia has continued to experience higher household power bills (figure 5) over the past decade. With the retirement of the Hazelwood power station in Victoria wholesale electricity costs have risen, so Energy cost pressures will continue. At the same time, we have seen increased supply reliability issues in some parts of the NEM. Figure 5: Household Energy price indexSource: Australian Bureau of Statistics ( 2016 ) Consumer Price Index, Australia, June 2016ii The Australian Energy Market Commission s most recent annual Residual Electricity Price Trends REPORT also states that the annual electricity bill will increase in the majority of states, except Queensland.
10 This was attributed largely to increases in the competitive market component of electricity pricesiii. Victoria and South Australia are expected to experience the greatest rise in electricity prices, with the expectation that there will be a further jump in their electricity bills in 2017/18. Consequently, consumers are likely to seek to better manage their power bills which will 50100150200250300350400 Index Jun 1990=100 ElectricityGas8 8 help continue to drive interest in SOLAR (as well as battery storage in future). As mentioned above we have already seen South Australia and Victoria installing more SOLAR PV systems.