Transcription of Solid State Drive vs. Hard Disk Drive Price and ...
1 Solid State Drive vs. Hard Disk Drive Price and Performance Study A dell Technical White Paper dell PowerVault Storage Systems Vamsee Kasavajhala dell PowerVault Technical Marketing THIS WHITE PAPER IS FOR INFORMATIONAL PURPOSES ONLY, AND MAY CONTAIN TYPOGRAPHICAL ERRORS AND TECHNICAL INACCURACIES. THE CONTENT IS PROVIDED AS IS, WITHOUT EXPRESS OR IMPLIED WARRANTIES OF ANY KIND. 2011 dell Inc. All rights reserved. Reproduction of this material in any manner whatsoever without the express written permission of dell Inc. is strictly forbidden. For more information, contact dell . dell , the dell logo, the dell badge, EqualLogic, PowerEdge, and PowerVault are trademarks of dell Inc. Other trademarks and trade names may be used in this document to refer to either the entities claiming the marks and names or their products.
2 dell Inc. disclaims any proprietary interest in trademarks and trade names other than its own. May 2011 ABSTRACT Solid State drives (SSDs) offer exceptional performance; however, compared to hard disk drives (HDDs) they have much less capacity per Drive and are much more expensive. Additionally, each enterprise application workload has different capacity and performance requirements. Consequently, the challenge before IT departments is to navigate the Price , performance, and capacity trade-offs between SSDs and HDDs to determine the best, most cost effective Drive type for each application workload type. This technical report provides Price vs. performance results from tests performed at dell Labs for SSD and HDD drives under various simulated workloads.
3 The objective is to provide customers with recommendations on Drive types that are best suited for some common applications. The report also includes an overview of dell storage arrays suited to both SSD and HDD Drive types, as well as an overview of tiered SSD/HDD storage, which enables IT departments to cost effectively take advantage of the best properties of both Drive types. Page 1 Contents Introduction .. 2 Brief Overview of HDD and SSD Technologies .. 2 Measuring HDD and SSD Workload Performance .. 3 Price vs. Performance Test Results .. 4 Random Access Workload Microsoft Exchange Email .. 6 Summary .. 8 Sequential Workloads .. 8 Random Workloads .. 8 Putting it All Together Manual and Automatic Tiering Implementation .. 9 Appendix A: Overview of dell Storage Arrays.
4 11 PowerVault Storage Solutions Overview .. 11 PowerEdge Servers Overview .. 12 EqualLogic Storage Solutions Overview .. 12 Appendix B: Related Publications .. 13 Page 2 Introduction The traditional mainstay in storage technology has been the hard disk Drive (HDD). However, while the capacity of HDDs has increased 40% annually, their random input/output (I/O) performance has increased only 2% annually. This means that for some of today s enterprise, web, cloud, and virtualized applications that require both high capacity and performance, HDDs may not deliver a cost-effective storage solution, even with their significant drop in cost per GB. Recently, an alternative storage device technology, the Solid State Drive (SSD), has started to gain prominence.
5 SSDs offer exceptionally high performance but have much less capacity per Drive . They are also relatively expensive when compared to HDDs, and have a write endurance limit. Given the properties of HDDs and SSDs, IT departments now have a choice, but also a challenge, in determining the best way to cost-effectively fulfill the performance and capacity requirements of their enterprise applications. To meet this challenge and determine how they should integrate HDDs and SSDs into their storage fabric, IT departments must first quantify the performance, capacity, and cost value of SSDs vs. HDDs for different applications. This white paper provides the results of SSD and HDD standalone performance testing at dell Labs with various simulated application workloads.
6 The objective is to provide IT departments with the information they need to most effectively take advantage of the different cost, performance, and capacity characteristics provided by HDDs and SSDs. In addition, this white paper provides an overview of the dell PowerVault MD Storage and PowerEdge server families and shows how the architecture seamlessly integrates with both HDDs and SSDs. The paper concludes by showing how IT departments can leverage automatic tiering between SSD and HDD drives in an EqualLogic PS Series SAN to both reduce cost and improve performance. NOTE: For this analysis, we assumed that the SSD write endurance limit would not affect the cost of ownership, and that the write duty cycle (amount of time spent writing in a 24 hour period) is approximately 10%.
7 Brief Overview of HDD and SSD Technologies HDDs are spinning disks, and their mechanical actions can create a delay in data retrieval. SSDs, built from silicon memory chips, have no moving parts, no rotational delay, and near zero seek time, which dramatically reduces response times. SSDs can be extremely valuable to applications that need high performance as measured by access latency and input/output operations per second (IOPS) from a limited capacity. Page 3 Measuring HDD and SSD Workload Performance We set up eleven application I/O workload profiles (Table 1). For each profile, we used the IOmeter application to simulate the workload and measure the corresponding I/O. The analysis was done with the IOmeter 2006 version, which has more randomized data content than the 2008 version.
8 For more information about the IOmeter, see Table 1. Application I/O Workload Profiles Application Application I/O Workload Profile Block Size in Bytes Read/Write Percentage Random/Sequential Percentage I/O Performance Metric* Web File Server 4KB, 8KB, 64KB 95%/5% 75%/25% IOPS Database Online Transaction Processing (OLTP) 8KB 70%/30% 100%/0% IOPS Exchange Email 4KB 67%/33% 100%/0% IOPS OS Drive 8KB 70%/30% 100%/0% IOPS Decision Support Systems (DSS) 1MB 100%/0% 100%/0% IOPS File Server 8KB 90%/10% 75%/25% IOPS Video on Demand 512KB 100%/0% 100%/0% IOPS Web Server Logging 8KB 0%/100% 0%/100% MBPS SQL Server Logging 64KB 0%/100% 0%/100% MBPS OS Paging 64KB 90%/10% 0%/100% MBPS Media Streaming 64KB 98%/2% 0%/100% MBPS *Metric measurements: IOPS = I/O operations per second MBPS = Megabytes per second Page 4 Each profile was executed on a server connected to the target drives under test in a standalone mode via an H200 internal RAID adapter in a non-RAID configuration.
9 The target drives used were 10K RPM SAS HDD, Enterprise Value SSD, and Enterprise Mainstream Performance SSD. Table 2 outlines the differences between the two SSD types (Enterprise Value and Enterprise Mainstream Performance). Table 2. Differences Between Enterprise Mainstream Performance SSD and Enterprise Value SSD Characteristics Enterprise Mainstream Performance SSD (Pliant 149GB) Enterprise Value SSD (Samsung SS805) Host Interface SAS SATA Performance (8K transfers, 70/30 R/W, QD = 4) 7K 10K IOPS 4K 6K IOPS Flash Memory Technology SLC NAND SLC NAND Capacity 149 GB 100 GB Target Storage and Server Mid- to High-Range Storage and Server Low- to Mid-Range Storage and Server Price vs. Performance Test Results In this section, we present two sample test results one each for sequential and random-access workloads that clearly demonstrate the performance and cost differences between SSD and HDD.
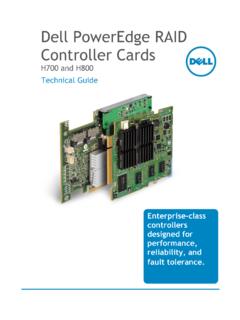
10 The prices comparisons of the three drives in terms of Price (US$) per GB capacity is shown in Figure 1. NOTE: For all tests described in this white paper, we used the dell Americas region list prices as of the publication date of this paper. In addition, the Price was normalized to US dollars per 100 GB. For example, the normalized Price for a 150 GB Drive with a list Price of US $ is: 90*100/150 GB = $ Figure 1. Price /GB Comparison: Enterprise Mainstream Performance SSD, Enterprise Value SSD, and 10K SAS HDD $ $ $ $ $ $ $ $ $/GB Enterprise Mainstream Performance SSDE nterprise Value SSD10K SAS HDD Page 5 Sequential Access Workload Media Streaming Media streaming is an example of a sequential access workload. Media streaming servers are systems that provide web-casting, video conferencing, Internet entertainment (for example, Internet TV or radio), and multimedia services.