Transcription of Spinal Cord Injury Facts and Figures at a Glance
1 Spinal Cord Injury Facts and Figures at a Glance 2020 SCI Data Sheet This data sheet is a quick reference on demographics and the use of services by people with Spinal cord Injury in the United States ( ). Much of the information reflects recent data collected since 2015. Historical information reflects data collected since the early 1970s. The National Spinal Cord Injury Database is a prospective longitudinal multicenter study that currently captures data from an estimated 6% of new SCI cases in the United States. The database has demographic and condition status data through 2019 for 34,130 people with SCI. National SCI Statistical Center 515 Spain Rehabilitation Center 1717 6th Avenue South Birmingham, AL 35233-7330 For Statistics: 205-934-3342 For Business: 205-934-3320 TDD: 205-934-4642 FAX: 205-934-2709 E-mail: Website: Incidence Given the current population size of 329 million people, a recent estimate showed that the annual incidence of Spinal cord Injury (SCI) is approximately 54 cases per one million people in the United States, or about 17,810 new SCI cases each year.
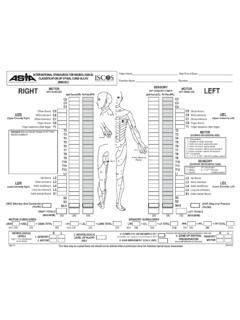
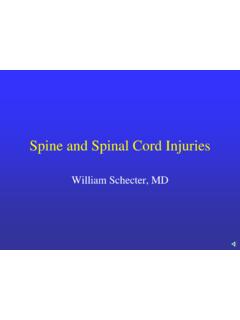
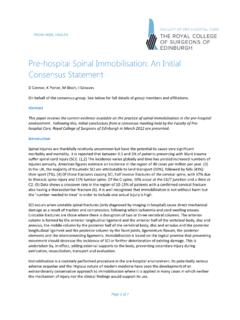
2 New SCI cases do not include those who die at the location of the incident that caused the SCI. Data Source: Jain NB, Ayers GD, Peterson EN, et al. Traumatic Spinal cord Injury in the United States, 1993-2012. JAMA. 2015;313(22):2236-2243. Prevalence The estimated number of people with SCI living in the United States is approximately 294,000 persons, with a range from 250,000 to 368,000 persons. Data Source: Lasfargues JE, Custis D, Morrone F, Carswell J, Nguyen T. A model for estimating Spinal cord Injury prevalence in the United States. Paraplegia. 1995;33(2):62-68. Age at Injury The average age at Injury has increased from 29 years during the 1970s to 43 since 2015. Gender About 78% of new SCI cases are male. Race/Ethnicity Recently, about 24% of injuries have occurred among non-Hispanic blacks, which is higher than the proportion of non-Hispanic blacks in the general population (13%). Cause Vehicle crashes are the most recent leading cause of Injury , closely followed by falls.
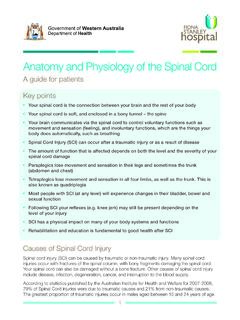
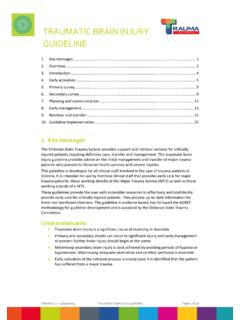
3 Acts of violence (primarily gunshot wounds) and sports/recreation activities are also relatively common causes. A customizable Leading Causes of SCI tool is at Lengths of Stay Lengths of stay in the hospital acute care unit have declined from 24 days in the 1970s to 11 days recently. Rehabilitation lengths of stay have also declined from 98 days in the 1970s to 31 days recently. Neurological Level and Extent of Lesion Recently, incomplete tetraplegia is the most frequent neurological category. The frequency of incomplete and complete paraplegia is virtually the same. Less than 1% of persons experienced complete neurological recovery by the time of hospital discharge. 2015 Non-Hispanic WhiteNon-Hispanic BlackHispanic OriginNative 2015 2015 Incomplete TetraplegiaIncomplete ParaplegiaComplete ParaplegiaComplete TetraplegiaNormal Education Since 2015, about a quarter of persons with SCI have a college degree at the time of their Injury , compared with 45% of people who survived 40 years of Injury .
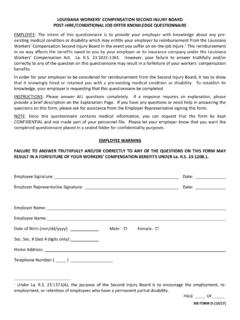
4 Education (%) At Injury Year 1 Year 10 Year 20 Year 30 Year 40 High School Only College or Higher Occupational Status Since 2015, 18% of persons with SCI are employed at year 1 post- Injury . The employment rate increases over time to 32% at 40 years post Injury . Status (%) At Injury Year 1 Year 10 Year 20 Year 30 Year 40 Employed Student Marital Status Since 2015, the percentage of people who are married is relatively consistent up to year 40 post- Injury , with single/never married status slowly decreasing and divorce status slowly increasing. Status (%) At Injury Year 1 Year 10 Year 20 Year 30 Year 40 Single Married Divorced Re-Hospitalization Since 2015, about 30% of persons with SCI are re-hospitalized one or more times during any given year following Injury . Among those re-hospitalized, the length of hospital stay averages about 18 days. Diseases of the genitourinary system are the leading cause of re-hospitalization, followed by disease of the skin.
5 Respiratory, digestive, circulatory, and musculoskeletal diseases are also common causes. Historical Lifetime Costs The average yearly expenses (health care costs and living expenses) and the estimated lifetime costs that are directly attributable to SCI vary greatly based on education, neurological impairment, and pre- Injury employment history. The below estimates do not include any indirect costs such as losses in wages, fringe benefits, and productivity (indirect costs averaged $77,701 per year in 2019 dollars). Severity of Injury Average Yearly Expenses (in 2019 dollars) Estimated Lifetime Costs by Age at Injury (discounted at 2%) First Year Each Subsequent Year 25 years old 50 years old High Tetraplegia (C1 C4) AIS ABC $1,149,629 $199,637 $5,100,941 $2,803,391 Low Tetraplegia (C5 C8) AIS ABC $830,708 $122,468 $3,727,066 $2,292,479 Paraplegia AIS ABC $560,287 $74,221 $2,494,338 $1,636,959 Motor Functional at Any Level AIS D $375,196 $45,572 $1,704,144 $1,202,832 Data Source: Economic Impact of SCI published in the journal Topics in Spinal Cord Injury Rehabilitation, Volume 16, Number 4, in 2011.
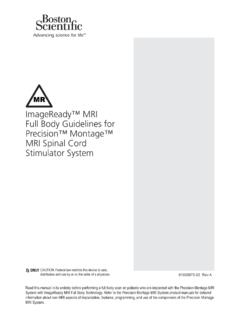
6 ASIA Impairment Scale (AIS) is used to grade the severity of a person s neurological impairment following Spinal cord Injury . Historical Life Expectancy The average remaining years of life for persons with SCI have not improved since the 1980s and remain significantly below life expectancies of persons without SCI. Mortality rates are significantly higher during the first year after Injury than during subsequent years, particularly for persons with the most severe neurological impairments. A customizable Life Expectancy Calculator tool is at Age at Injury No SCI Life Expectancy (years) for Post- Injury by Severity of Injury and Age at Injury For Persons Who Survive the First 24 Hours For Persons Surviving at Least 1 Year Post- Injury AIS D Motor Functional at Any Level Para Low Tetra (C5 C8) High Tetra (C1 C4) Ventilator Dependent Any Level AIS D Motor Functional at Any Level Para Low Tetra (C5 C8) High Tetra (C1 C4) Ventilator Dependent- Any Level 20 40 60 Historical Causes of Death Persons enrolled in the National SCI Database have now been followed up to 45 years after Injury .
7 During that time, the causes of death that appear to have the greatest impact on reduced life expectancy for this population are pneumonia and septicemia. Mortality rates are declining for cancer, heart disease, stroke, arterial diseases, pulmonary embolus, urinary diseases, digestive diseases, and suicide. However, these gains are being offset by increasing mortality rates for endocrine, metabolic and nutritional diseases, accidents, nervous system diseases, musculoskeletal disorders, and mental disorders. There has been no change in the mortality rate for septicemia in the past 45 years, and there has only been a slight decrease in mortality due to respiratory diseases. 2020 Board of Trustees, University of Alabama. This is a publication of the National Spinal Cord Injury Statistical Center in collaboration with the Model Systems Knowledge Translation Center. The contents of this publication were developed under grants from the National Institute on Disability, Independent Living, and Rehabilitation Research (NIDILRR grant numbers 90DP0083 and 90DP0082).
8 NIDILRR is a Center within the Administration for Community Living (ACL), Department of Health and Human Services (HHS). The contents of this publication do not necessarily represent the policy of NIDILRR, ACL, HHS, and you should not assume endorsement by the Federal Government. Data from the National SCI Database is from 29 federally funded SCI Model Systems since 1973. Presently, there are 14 systems and 5 Form II (follow up) centers sponsored by NIDILRR. For a complete list of current SCI Model Systems, go to Document Citation: National Spinal Cord Injury Statistical Center, Facts and Figures at a Glance . Birmingham, AL: University of Alabama at Birmingham, 2020.