Transcription of State Median Income and Federal Poverty Guidelines ...
1 State Median Income and Federal Poverty Guidelines Calculation ToolChild Care and Development Fund Lead Agencies use Federal Poverty Guidelines (FPG) and State Median Income (SMI) estimates to establish Income eligibility limits and sliding fee scales for child care subsidy programs. The Child Care and Development Fund final rule sets the maximum family Income eligibility for child care subsidy at a level equal to or less than 85% of SMI. This tool will assist Lead Agencies with completing the calculations needed to set Income limits and sliding fee scales. The Office of Child Care provides Lead Agencies with the option to use a three-year rolling average of the SMI estimates if Income levels decrease in any single year. The discussion in the final rule preamble encourages Lead Agencies to consider using a three-year estimate to lessen the impact of a single year fluctuation and to align with the Low Income Home Energy Assistance Program s eligibility criteria.
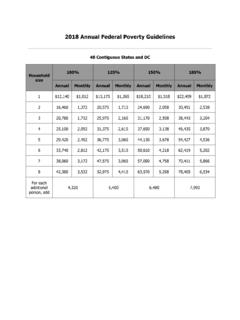
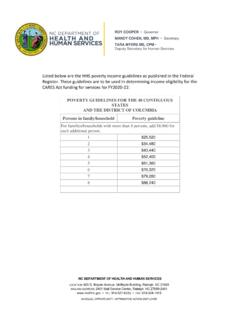
2 There have been no decreases in the SMI estimates over the past three years. Excel worksheets 2 - 5 automatically calculate the SMI estimates in 5% increments up to 100% of each State or territory's SMI level based on the user's entry of State or territory name. Below are links to the SMI estimates for the three most current Federal fiscal years and the current FPG. Links to the State Median Income Estimates by Federal Fiscal Year:FFY 2022: 2021: 2020: to the HHS Federal Poverty Guidelines for 2021: is important to note that the SMI estimates published by the Census Bureau contain a list of all states , the district of Columbia (DC), and Puerto Rico. SMI estimates are effective for each Federal fiscal year beginning on October 1st. The FPG for the 48 contiguous states , DC, and Puerto Rico are the same. Alaska and Hawaii have their own FPG. This is why the SMI and FPG comparisons for Alaska and Hawaii are on separate sheets.
3 Unlike the SMI estimates, FPG are established by calendar year, starting in remain current, NCSIA will update this tool as changes occur. Typically updates are released every January for FPG, and sometime between mid-May and August for SMI and FPG Calculation Tool Instructions Description of the WorksheetsSheet 1. Instructions: Contains the instructions for using the tool and the links to the three most recent SMI estimates and most current 2. Annual & Monthly SMI Amounts: Populates the annual and monthly SMI estimates. The user must select the State /territory name and its SMI estimate for the current year will auto-populate. (No State /territory had a decrease to SMI estimates.)Sheet 3. SMI & FPG Comparison: Compares the 2022 SMI estimates to the 2021 FPG for the 48 contiguous states , DC, and Puerto Rico for each increment contained in the table; this worksheet is auto-populated based on user selections in Sheet 2.
4 This worksheet should not be used to compare the SMI estimates and FPG for Alaska and Hawaii, since these states have their own FPG (see sheets 4 and 5).Sheet 4. Alaska SMI & FPG: Compares the SMI estimates for Alaska to their FPG for each increment contained in the table. This worksheet is 5. Hawaii SMI & FPG: Compares the SMI estimates for Hawaii to the FPG for each increment contained in the table. This worksheet is 6. Territory SMI & FPG Comp.: Compares the SMI estimates for territories to their FPG for each increment contained in the table. The SMI estimate is manually entered by the territory; this worksheet is intended for territories that do not have published SMI estimates. The FPG are auto-populated. Sheet 7. FPG Source: Contains the FPG for the most current calendar year. The figures are used to auto-populate the other worksheets. Sheet 8.
5 SMI Source: Contains the SMI estimates for the three most current Federal fiscal years. The figures are used to auto-populate the other worksheets. InstructionsStep 1. Click on Sheet 2, Annual & Monthly SMI Amounts, and select the State or territory for which the Income estimates will be calculated. The SMI estimate will 2. Click on Sheet 3, SMI & FPG Comparison, will automatically calculate the FPG comparisons for the 48 contiguous states , DC, and Puerto Rico. Please note, Alaska and Hawaii can use Sheet 2 to calculate their SMI estimates. However, because these states have their own FPG, users will need to proceed to Step 4 to calculate the SMI/FPG 3. See Sheet 4, Alaska SMI & FPG Comparison, or Sheet 5, Hawaii SMI & FPG Comparison, or Sheet 6, Territory SMI & FPG Comp., to calculate the SMI/FPG comparisons for Alaska and Hawaii and territories, respectively.
6 Worksheets 4 and 5 are pre-populated; while worksheet 6, requires the end-user to enter the territory name and its SMI estimate. 2 Note: The worksheets are protected to prevent users from accidentally changing the formulas in the cells. Users can only enter data into cells as described above.
