Transcription of State of the Tech Workforce 2022
1 State of the tech Workforce Nationwide | State | Metro Area 2022. tech Hiring Trends | Wages | Workforce Characteristics | COPYRIGHT PAGE. Copyright 2022 CompTIA, State OF THE tech Workforce | CYBERSTATES 2022 Inc. All rights reserved. IS PRODUCED BY CompTIA and Cyberstates are The Computing Technology Industry Association (CompTIA) registered trademarks of CompTIA, Inc. in the and internationally. Other brands and company names mentioned herein may be trademarks or service marks of CompTIA, Inc. or of their respective owners. Any data or content used from this report should be properly sourced to CompTIA. Published in the March 2022. CompTIA is responsible for all content and analysis. Any questions regarding the report should be directed to CompTIA. Research and Market Intelligence staff at State of the tech Workforce can be accessed online at CompTIA. 3500 Lacey Road, Suite 100. Downers Grove, IL 60515. Phone: (630) 678 - 8300. Copyright 2022 CompTIA | | | State of the tech Workforce | Page 2.
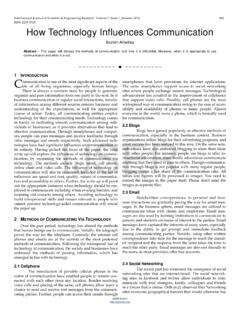
2 ABOUT. ABOUT COMPTIA. The Computing Technology Industry Association (CompTIA) is a leading voice and advocate for the $5 trillion global information technology ecosystem; and the estimated 75 million industry and tech professionals who design, implement, manage, and safeguard the technology that powers the world's economy. Through education, training, certifications, advocacy, philanthropy, and market research, CompTIA is the hub for unlocking the potential of the tech industry and its Workforce . CompTIA is the world's leading vendor-neutral IT-certifying body with more than million certifications awarded based on the passage of rigorous, performance-based exams. CompTIA sets the standard for preparing entry-level candidates through expert-level professionals to succeed at all stages of their career in technology. Through CompTIA's philanthropic arm, CompTIA develops innovative on-ramps and career pathways to expand opportunities to populations that traditionally have been under-represented in the information technology Workforce .
3 CompTIA Technology Career Pathway Roadmap CompTIA Certifications Job Match CompTIA Training and Learning CompTIA tech Career Academy CompTIA IT Salary Calculator CompTIA Member Communities and Councils CompTIA Academy and Delivery Partner Program ABOUT State OF THE tech Workforce . CompTIA designed State of the tech Workforce , also referred to as Cyberstates, to serve as a reference tool, making national, State , and metro area-level data accessible to a wide range of users. State of the tech Workforce quantifies the size and scope of the tech industry and the tech Workforce across multiple vectors. To provide additional context, the report includes time-series trending, average wages, business establishments, job postings, gender ratios, innovation and emerging tech metrics, and more. For the interactive online version, please visit As with any sector-level report, there are varying interpretations of what constitutes the tech sector and the tech Workforce .
4 Some of this variance may be attributed to the objectives of the author. Is the goal to depict the broadest possible representation of STEM and digital economy fields, or a more narrowly defined technology subset? Is the goal to capture all possible knowledge workers, or a more narrowly defined technology subset? CompTIA weighs a number of factors in making these decisions. See the methodology section for details of the specific NAICS codes and SOC codes CompTIA uses in its definitions. NOTE: INDUSTRY DEFINITION CHANGE. In response to user feedback and organizational needs, CompTIA adjusted the industry and occupation definitions this year to focus on a more narrow subset of core information technology categories. The data in the 2022 release will not be directly comparable to the prior year releases, although portions of the prior definition data can be found in the Appendix. CompTIA's base of IT certification holders spans 232 countries Copyright 2022 CompTIA | | | State of the tech Workforce | Page 3.
5 TABLE OF CONTENTS. BACKGROUND AND KEY FINDINGS 5. NATIONAL SNAPSHOT 15. State SNAPSHOTS 17. METRO AREA SNAPSHOTS 69. APPENDIX TABLES - A 121. NET tech EMPLOYMENT TRENDING BY State . NET tech EMPLOYMENT TRENDING BY METRO. RANKINGS: NET tech EMPLOYMENT BY State . RANKINGS: NET tech EMPLOYMENT BY METRO. APPENDIX TABLES - B 128. tech Workforce CHARACTERISTICS BY RACE AND ETHNICITY BY State . tech Workforce CHARACTERISTICS BY RACE AND ETHNICITY BY METRO. tech Workforce CHARACTERISTICS BY GENDER BY State . tech Workforce CHARACTERISTICS BY GENDER BY METRO. tech Workforce CHARACTERISTICS BY OCCUPATION BY AGE. tech Workforce CHARACTERISTICS BY INDUSTRY. APPENDIX TABLES - C 136. tech EMPLOYMENT OUTLOOK BY OCCUPATION: 2022-2032. tech EMPLOYMENT OUTLOOK BY State : 2022-2032. tech EMPLOYMENT OUTLOOK BY METRO: 2022-2032. APPENDIX TABLES - D 140. tech WAGE PERCENTILES BY State . tech WAGE PERCENTILES BY METRO. APPENDIX TABLES - E 143. tech INDUSTRY SECTOR DETAIL BY State . tech INDUSTRY SECTOR DETAIL BY METRO.
6 APPENDIX TABLES - F 146. EMPLOYER JOB POSTINGS BY State . EMPLOYER JOB POSTINGS BY METRO. APPENDIX TABLES - G 149. PRIOR REPORTING DEFINITION NET tech EMPLOYMENT BY State . PRIOR REPORTING DEFINITION NET tech EMPLOYMENT BY METRO. PRIOR REPORTING DEFINITION tech INDUSTRY DETAIL BY State . PRIOR REPORTING DEFINITION tech INDUSTRY DETAIL BY METRO. METHODOLOGY 154. BACKGROUND. tech INDUSTRY AND OCCUPATIONS CLASSIFICATIONS. Copyright 2022 CompTIA | | | State of the tech Workforce | Page 4. DEFINING NET tech EMPLOYMENT. The tech Workforce consists of two primary components, represented as a single figure by the net tech employment' designation. The foundation is the set of technology professionals working in technical positions, such as IT support, network engineering, software development, data scientist, and related roles. Many of these professionals work for technology companies (41 percent), but many others are employed by organizations across every industry sector in the economy (59 percent).
7 The second component consists of the business professionals employed by technology companies. These professionals encompassing sales, marketing, finance, HR, operations and management, play an important role in supporting the development and delivery of the technology products and services used throughout the economy. Approximately 39 percent of the net tech -employment total consists of tech industry business professionals. One final segment involves workers classified as self-employed. For the purposes of this report, only dedicated, full-time self-employed technology workers are counted towards net tech employment. Workers that are characterized as gig workers, which may entail working on the side for supplementary income, are excluded from this analysis due to several uncertainties with the data and to minimize the possibility of double counting. N = Technology professionals employed across the economy, including in the tech sector ( software developers, network architects, database admins, etc.)
8 N = tech sector employment, less technology professionals ( sales, marketing, finance, HR, etc.). million Projected total workers in 2022 61%. % of NET tech employment is in technology occupations = 100,000 workers Source: EMSI Burning Glass | Bureau of Labor Statistics | CompTIA. IMPORTANT NOTE: definition change of tech industry and occupation employment; results will not be directly comparable to prior year reporting Copyright 2022 CompTIA | | | State of the tech Workforce | Page 5. YEAR IN REVIEW. KEY POINTS NET tech EMPLOYMENT TRENDING. After two years the global pandemic continues to be a drag on +177,705. the economy and labor market. While the national +79,922 + unemployment edges down to near pre-pandemic levels, + many workers voluntarily or involuntarily remain on the sidelines. See CompTIA's Workforce and Learning Trends for a MILLIONS OF WORKERS. discussion of the Great Resignation and its implication for the tech Workforce . The tech sector and the broader base of technology workers employed across the economy experienced several bumps during this turbulent period, but generally held up well.
9 In some cases, demand for technology services and infrastructure to support new remote work models, ecommerce, or revamped supply chains exploded, stretching the capacity of solution providers and MSPs. These positives, however, were at times offset by reductions 2016 2017 2018 2019 2020 2021 2022. or postponements in spending and hiring of tech workers, est. proj . especially in the hardest hit industry sectors of transportation, hospitality, entertainment and related. tech INDUSTRY EMPLOYMENT TRENDING. Net tech employment in the United States as described on the previous page, reached an estimated 8,679,198 workers in 2021, an increase of nearly 1% year-over-year or approximately 80,000 additional workers employed in Software [product]. technology. tech Manufacturing MILLIONS OF WORKERS. At the time of writing, tech employment was off to a strong start during the first two months of 2022. If the momentum Telecommunications and Internet Services continues and the economy returns to a degree of normalcy, net tech employment could reach its projected target of 8,856,902, which translates to 177,705 net new workers added or + growth.
10 IT Services and Custom Software Services Among the components of net tech employment, the tech sector side of the equation is projected to grow in the year ahead, with the occupation side across the economy is 2016 2017 2018 2019 2020 2021 2022. projected to grow at an identical rate ( ). tech occupation est. proj . employment within the tech industry is projected to grow at the fastest rate: vs. tech occupation employment across tech OCCUPATION EMPLOYMENT TRENDING. the economy Systems, Cybersecurity and Data Top projected growth occupations for 2022: CIOs , IT Directors, Emerging tech and Other Data Scientists IT Sup port, Network Admin and Architectu re Software, Pro grammers, Web and QA. Cybersecurity Software Developers and Software QA. MILLIONS OF WORKERS. Computer and Information Research Scientists Web Developers and Digital Interface Designers Emerging tech , IT Project Mgt. and Other IT Support Specialists 2016 2017 2018 2019 2020 2021 2022. est.