Example: tourism industry
State-Space Models - Statistics Department
parametric ARMA models as concise expressions for the lag weights as functions of the underlying ARMA parameters, j = j(˚; ): X t = X j j(˚; )w t j: This expression writes each observation as a function of the entire his-tory of the time series. State-space models represent the role of history di erently in a nite-dimensional vector, the ...
Tags:
Information
Domain:
Source:
Link to this page:
Documents from same domain

Forecasting ARMA Models
www-stat.wharton.upenn.eduForecasts revert quickly to series mean Unless model is non-stationary or has very strong autocorrelations Prediction intervals open as extrapolate Variance of prediction errors rapidly approaches series variance 8-10.00-5.00 0.00 5.00 10.00 Y 196 198 200 202 204 206 208 210 Rows observed forecast

Algorithmic Criminology - Statistics Department
www-stat.wharton.upenn.educhild for these approaches ... 2Usual criminology practice begins with a statistical model of some criminal justice process assumed to be have generated the data.
Featurizing Text: Converting Text into Predictors for ...
www-stat.wharton.upenn.eduquantitative features extracted from text can elucidate the structure of a model. Key Phrases: sentiment analysis, n-gram, latent semantic analysis, text mining Research supported by NSF grant 1106743 1

Logs In Regression - Statistics Department
www-stat.wharton.upenn.eduStatistics 621 Robert Stine Fall, 2001 1
BART: Bayesian Additive Regression Trees
www-stat.wharton.upenn.eduditive Regression Trees) which uses a sum of trees to model or approximate f(x) = E(Y j x). The essential idea is to elaborate the sum-of-trees model (2) by imposing a prior that regularizes the flt by keeping the individual tree efiects small. In efiect, the gj’s become a dimensionally adaptive random basis of \weak

The Yule Walker Equations for the AR Coefficients
www-stat.wharton.upenn.edu• multiply both sides of the model by x i, x ix i+1 = Xp j=1 (φ jx ix i−j+1)+x iξ i+1, where i and j are the time and term indices, respectively, • take expectance, hx ix i+1i = Xp j=1 (φ jhx ix i−j+1i)+hx iξ i+1i where the {φ j}s are kept outside the expectance operator because they are deterministic, rather than statistical ...
Practice Questions: Multiple ... - Statistics Department
www-stat.wharton.upenn.educertain features of the vehicle, particularly those relating to its performance. Among the predictors, the displacement measures the size of the engine in cubic inches, and ... Statistics 621 Multiple Regression Practice Questions
Explaining Normal Quantile ... - Statistics Department
www-stat.wharton.upenn.edudistribution that de nes the y-axis; choices include a normal distribution, the shown gamma distribution (with shape parameter 3), a beta distribution, t-distributions (with 3 and 6 degrees of freedom), and a mixture of a normal and gamma. 3 Empirical QQ plots Applying this analogy to the normal QQ plot of data requires more work and imagina-

Analysis of Variance for Regression/Multiple Regression
www-stat.wharton.upenn.eduMultiple Linear Regression Model One possible model for the population regression function is the multiple linear regression model, an analogue of the simple linear regression model: " " Interpretation of: The change in the mean of if is increased by one unit and all other explanatory variables, " are held fixed.
Related documents
Parametric vs Nonparametric Models - Max Planck Society
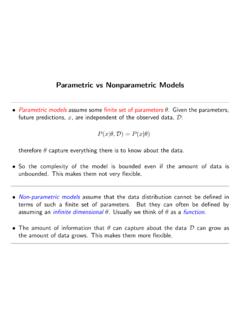
mlss.tuebingen.mpg.deParametric vs Nonparametric Models • Parametric models assume some finite set of parameters .Giventheparameters, future predictions, x, are independent of the observed data, D: P(x| ,D)=P(x| ) therefore capture everything there is to know about the data. • So the complexity of the model is bounded even if the amount of data is unbounded.

Creo® Parametric TOOLKIT User’s Guide
support.ptc.comSupport for File Names in Non-Creo Models ..... 706 Character Support for File Names in Non-Creo Models..... 706 Working with Multi-CAD Models in Creo Parametric TOOLKIT ..... 707 8 Creo® Parametric TOOLKITUser’s Guide
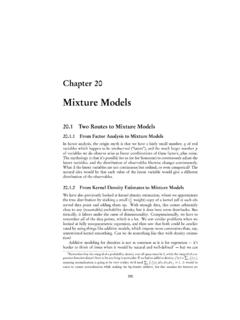
Mixture Models - Carnegie Mellon University
www.stat.cmu.edu20.2 Estimating Parametric Mixture Models From intro stats., we remember that it’s generally a good idea to estimate distribu-tions using maximum likelihood, when we can. How could we do that here? Remember that the likelihood is the probability (or probability density) of ob-serving our data, as a function of the parameters.

Creo Parametric Configuration Options
support.ptc.commodels. yes, no no Assembly enable_advance_collision Enables advance collision settings usage. yes, no no Assembly enable_assembly_accuracy No ‐ Disables accuracy modification for assembly objects. yes, no yes PTC Inc. 4 Creo 3.0 Parametric Configuration Options
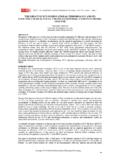
THE IMPACT OF ICT ON EDUCATIONAL PERFORMANCE AND …
tojet.neteducation performance is presented, then the methodology is established and the specifications of the models are defined. The next section outlines the results of the non-parametric efficiency analysis and presents partial . TOJET: The Turkish Online Journal of Educational Technology – July 2012, volume 11 Issue 3

Real Time Release Testing guideline
www.ema.europa.eusterilised in their final container i.e. parametric release. 1,2. Enhanced product knowledge and process understanding, the use of quality risk management principles and the application of an appropriate ... of any prediction models should be fully explained, justified and verified at the commercial site. ...
Parametric Survival Models - Princeton University
data.princeton.eduParametric Survival Models Germ an Rodr guez grodri@princeton.edu Spring, 2001; revised Spring 2005, Summer 2010 We consider brie y the analysis of survival data when one is willing to assume a parametric form for the distribution of survival time. 1 Survival Distributions 1.1 Notation
![[FMM] Finite Mixture Models - Stata](/cache/preview/2/f/e/3/5/9/b/e/thumb-2fe359bec6e16b9423570fba22429479.jpg)
[FMM] Finite Mixture Models - Stata
www.stata.comthe subpopulation-specific models need not be limited to a mixture of normal densities. FMMs allow mixtures of linear and generalized linear regression models, including models for binary, ordinal, nominal, and count responses, and allow the inclusion of covariates with subpopulation-specific effects.