Transcription of Statistical Process Control (SPC) - GHSP
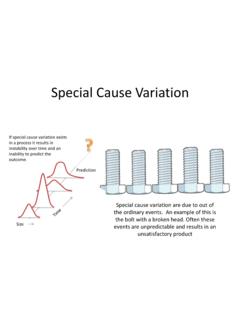
1 Statistical Process Control (SPC). Training Guide Rev X05, 09/2013. A JSJ Business What is data? Data is factual information (as measurements or statistics) used as a basic for reasoning, discussion or calculation. (Merriam-Webster Dictionary, ). What does this mean? Data allows us to make educated decisions and take action! A JSJ Business Why is Data Important? If we don't collect data about a Process then what? Without data we don't understand the Process / product So what? Without understanding of the Process / product we can't Control the outcome Is it important to Control the outcome? When you can't Control the outcome you are dependent on chance. You may have a good outcome, you may not. Without data collection you may not know either way. A JSJ Business Use of Data I'm not collecting data because its non value add. Without data collection there is no way to identify problems, continuously improve or ensure you are meeting the voice of the customer.
2 I'm collecting data, but not looking at it. Is that okay? No, the collection of data without analysis is a bigger waste than not collecting data in the first place. What should I be doing with the data? A JSJ Business DATA. Statistics Information that can be understood and acted on. A JSJ Business What are Statistics? A branch of mathematics dealing with the collection, analysis, interpretation and presentation of masses of numerical data (Merriam-Webster Dictionary, ). What does this mean? Once data is collected we can use appropriate Statistical methods to describe (understand) our Process / product and Control (predict) the Process /. product outcome A JSJ Business Statistics Allow us to Describe our Process / product Control (predict) Process / product outcomes Sample Population (125 (All Product). Pieces). A JSJ Business Important Notes 1.
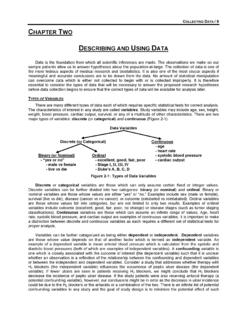
3 Statistical conclusions require useful data We need to measure the right thing Determining what data to collect and how to collect it are important steps in the APQP / continuous improvement Process 2. We need to have confidence the data collected is accurate A good measurement system is required to collect data Be sure the measurement system analysis (MSA) is acceptable before collecting data There is a separate training available for MSA. 3. Reduce / Eliminate Waste Data that doesn't provide useful information drives waste We want to gain the most useful information from the least amount of data A JSJ Business possible! Types of Data Variable Data (Continuous Data). Measurements on a continuous scale Examples Product Dimensions Weight Time Cost Process parameters (cutting speed, injection pressure, etc.). Attribute Data (Discrete Data).
4 Data by counting Examples Count of defective parts from production Number of chips on a painted part A JSJ Business Types of Attribute Data Binomial Distribution Pass / Fail (PPM). Number of defective bezels Number of defective castings Poisson Distribution Number of defects (DPMO). Number of defects per bezel Number of defects per casting A JSJ Business Which Type of Data is Better? Variable Data Attribute Data Pros: Pros: Provides useful information with smaller sample Very easy to obtain sizes Calculations are simple Can identify common cause concerns at low defect Data is usually readily available rates Good for metrics reporting / management review Can be used to predict product / Process outcomes Good for baseline performance (trends). Very useful for continuous improvement activities (DOE, Regression analysis, etc.). Cons: Data collection can be more difficult, requiring specific gauges or measurement methods Cons: Analysis of data requires some knowledge of Statistical methods ( Control charting, Regression Data collection can be more difficult, requiring analysis, etc.)
5 Specific gauges or measurement methods Analysis of data requires some knowledge of Statistical methods ( Control charting, Regression analysis, etc.). A JSJ Business Introduction to Statistics Goal: 1. Define basic Statistical tools 2. Define types of distributions 3. Understand the Central Limit Theorem 4. Understand normal distributions A JSJ Business Definitions Population: A group of all possible objects Subgroup (Sample): One or more observations used to analyze the performance of a Process . Distribution: A method of describing the output of a stable source of variation, where individual values as a group form a pattern that can be described in terms of its location, spread and shape. A JSJ Business Measures of Data Distribution Measures of Location Mean (Average). The sum of all data values divided by the number of data points Mode The most frequently occurring number in a data set Median (Midpoint).
6 Measures of Spread Range The difference between the largest and smallest values of a data set Standard Deviation The square root of the squared distances of each data point from the mean, divided by the sample size. Also known as Sigma ( ) A JSJ Business Distribution Types Discrete Binomial Poisson Continuous Normal Exponential Weibull Uniform A JSJ Business Central Limit Theorem The Central Limit Theorem is the basis for sampling and Control charting (of averages). There are 3 properties associated with the CLT;. 1. The distribution of the sample means will approximate a normal distribution as the sample size increases, even if the population is non-normal 2. The average of the sample means will be the same as the population mean 3. The distribution of the sample means will be narrower than the 1. distribution of the individuals by a factor of , where n is the.
7 Sample size. A JSJ Business CLT Property 1. Population Population The distribution of the sample means of any population will approximate a Population normal distribution as the sample Population size increases, even if the population is non-normal. Because of this property Control charts (for averages) is based on the normal distribution. Distribution of sample A JSJ Business means from any population The Normal Distribution 50% 50%. 1 = 2 = 3 = 2% 14% 34% 34% 14% 2%. -3 -2 -1 0 +1 +2 +3 . A JSJ Business Process CAPABILITY. A JSJ Business Process Capability Goal Understand Process capability and specification limits Understand the procedure of calculating Process capability Understand Cp, Cpk, Pp and Ppk indices Estimating percentage of Process beyond specification limits Understanding non-normal data Example capability calculation A JSJ Business Specification Limits Individual features (dimensions) on a product are assigned specification limits.
8 How do we determine a Process is able to produce a part that meets specification limits? LSL USL. Process Capability! A JSJ Business Process Capability and Specification Limits Process capability is the ability of a Process to meet customer requirements. LSL USL LSL USL. Acceptable capability Product outside of spec limits A JSJ Business Calculating Process Capability A JSJ Business Determine Stability All sample means and ranges and in Control and do not indicate obvious trends A JSJ Business Determine Normality Placing all data in a histogram may be used to help determine normality. If the data represents a normal curve. A JSJ Business Determine Normality A more Statistical method is to use the Anderson Darling test for normality In Minitab go to: Stat > Basic Statistics > Normality Test Select Anderson Darling and click ok A JSJ Business Interpreting Normality The p-Value must be greater than or equal to to match the normal distribution.
9 A JSJ Business Process Indices Indices of Process variation only, in regard to specification;. Cp and Pp Indices of Process variation and centering combined, in regard to specification;. Cpk and Ppk A JSJ Business NOTE. Before calculating capability or performance indices we need to make sure of a couple of things! 1. The Process needs to be stable (in Control ). 2. The Process needs to be normal 3. A completed MSA needs to prove the measurement system is acceptable If the above items are not met understand the results of the capability studies may be inaccurate. Also, per the AIAG PPAP manual (4th Edition) if the above items are not met corrective actions may be required prior to PPAP submittal. A JSJ Business Cp Overview . Cp = Potential Process Capability = =.. This index indicates potential Process capability. Cp is not impacted by the Process location and can only be calculated for bilateral tolerance.
10 A JSJ Business Subgroup Cp Calculation Size d2. 2 . 3 Cp = =. 6 4 6. 2 5 6 7 Where: 8 USL = Upper specification limit 9 LSL = Lower specification limit 10 = Average Range d2 = a constant value based on subgroup sample size A JSJ Business Interpreting Cp Garage Door Width Car <1. 1. 2. LSL USL. Cp = Number of times the car (distribution) fits in the garage (specification limit) A JSJ Business Cpk Overview Cpk is a capability index. It takes the Process location and the capability into account. Cpk can be calculated for both single sided (unilateral) and two sided (bilateral) tolerances. For bilateral tolerances Cpk is the minimum of CPU and CPL where: . CPU = = . and CPL = = . 3 3 3 3 . 2 2. Where: = Process average USL = Upper specification limit LSL = Lower specification limit = Average Range d2 = a constant value based on subgroup sample size.