Transcription of Statistics: Broiler Chickens
1 Statistics: Broiler Chickens Contents x Production: World, EU, UK. x Consumption: World, EU, UK. x Trade: World, EU, UK. x Housing Systems: World, EU, UK. x Key Health and Welfare Problems: EU, UK. Production World x Over 66 billion Chickens are slaughtered for meat in the world each year. (Source: FAOstat see Table 1). x Total global chicken meat production is nearly 110 million tonnes per annum. (Source: FAOstat see Table 1). x The largest producer of chicken by weight is the USA, accounting for nearly 18% of world chicken meat production. The highest producer of chicken by numbers, however, is China, accounting for over 14% of world production of Broiler Chickens . (Source: FAOstat see Table 1). Table 1: Chicken production 2017 Top 10 global production countries. (Source: FAOstat). Chicken meat Share of global chicken Chickens meat Country production 2017 meat production 2017 production by numbers (tonnes) by tonnage (%) 2017 (1000 head). World 109,056,179 100 66,566,725.
2 United States of America 19,140,744 9,050,716. Brazil 13,607,352 5,842,721. China 12,855,950 9,400,621. Russian Federation 4,444,334 2,542,310. India 3,519,959 2,536,004. Mexico 3,211,687 1,734,126. Indonesia 2,258,239 2,847,978. Japan 2,214,899 818,612. Iran (Islamic Republic of) 2,161,678 1,849,892. Turkey 2,136,734 1,228,444. Farm Animal Welfare Compendium Updated Page 1 of 1 0. Figure 1: Source: FAOstat. Share of global chicken meat production 2017 in tonnes (%). USA. 18%. Other 40% Brazil 12%. China 12%. Turkey 2%. Iran (Islamic Republic of). 2% Japan Mexico India Russian Federation 2% Indonesia 3% 3% 4%. 2%. EU. x Over billion Chickens were slaughtered for meat in the EU28 in 2017, producing over 12. million tonnes of chicken meat. (Source: FAOstat billion Chickens slaughtered in 2017, producing million tonnes; AVEC. Annual Report 2018 million tonnes chicken meat in 2017). UK. x In 2017, roughly billion Chickens were slaughtered for meat in the UK, producing approximately million tonnes of chicken meat.
3 (Source: FAOstat billion Chickens slaughtered in 2017, producing million tonnes chicken meat; Agriculture in the United Kingdom 2018 billion Chickens slaughtered in 2017, producing million tonnes chicken meat; AVEC Annual Report 2018 million tonnes chicken meat in 2017). x More recent provisional statistics suggest these numbers to be even higher now, with nearly billion Chickens slaughtered in 2018, producing almost million tonnes of chicken meat. (Source: Agriculture in the United Kingdom 2018 billion Chickens slaughtered in 2018, producing million tonnes of chicken meat in 2018). Farm Animal Welfare Compendium Updated Page 2 of 1 0. Consumption World x Average global poultry meat consumption per capita in 2017 was kg/head/year. NB. Poultry meat here includes all other forms of poultry; however, Broiler chicken meat will form the large majority. (Source: OECD-FAO agricultural outlook , 2018). Per capita meat consumption will increase by kg per annum, with poultry accounting for 70% of this increase.
4 Consumption of meat by 2021 is expected to increase mainly in the developing countries with an extra kg of meat per capita compared to the base period. The preferred meat for this increase shall be mostly poultry. The following figures are slightly dated but more recent ones do not appear to be available from AVEC. (Source: AVEC Annual Report 2012). Table 2: Poultry meat consumption (kg/person/year) Source: The Poultry Site: Global Poultry Trends - 2012). Figure 2: Global per capita poultry meat consumption trends by region (kg/person/year). (Source: The Poultry Site: Global Poultry Trends - 2012). Total world poultry meat consumption in 2012 was over million tonnes. (Source: OECD-FAO). Farm Animal Welfare Compendium Updated Page 3 of 1 0. EU. x Average Broiler chicken meat consumption per capita in 2017 in the EU28 was kg/head/yr. (Source: AVEC annual report 2018). x Total poultry meat consumption in the EU-27 was over million tonnes in 2011. (Source: AVEC Annual Report 2012).
5 UK. x Average Broiler chicken meat consumption per capita in the UK was kg/head/yr in 2016, increasing from kg/head/yr in 2015. (Source: AVEC annual report 2018). Brazil, China & USA. x In 2017, the average person from the USA consumed kg/head/yr. (Source: AVEC annual report 2018). x In Brazil, the average Broiler chicken meat consumption per capita in 2017 was kg/head/yr. (Source: AVEC annual report 2018). x Meanwhile in China, the average meat consumption per capita in 2017 was kg/head/yr. However, the size of the Chinese population must be accounted for here (as it is over 4 times larger than the USA's and almost 7 times larger than Brazil's). (Source: AVEC annual report 2018). Farm Animal Welfare Compendium Updated Page 4 of 1 0. Trading World x The largest exporter of chicken meat globally is Brazil, followed by the USA and the Netherlands. (Source: FAOstat see Table 3 and Figure 3). x The largest importer of chicken meat is Saudi Arabia, followed by Mexico and Hong Kong SAR.
6 Table 3: Chicken meat gross exports 2016 - top 10 global exporting countries. (Source: FAOstat). Chicken meat Share of global Country export 2016 chicken meat (tonnes) exports 2016 (%). World 13,019,802 Brazil 3,959,394 USA 3,112,266 Netherlands 1,044,822 Poland 618,388 China, Hong Kong SAR 518,490 Belgium 450,240 Turkey 314,695 France 312,827 Germany 305,527 UK 242,611 Figure 3: (Source: FAOstat). Share of global chicken meat exports 2016 (%). Germany UK. 2% 2%. Other France 17%. 2% Brazil Turkey 30%. 2%. Belgium 4%. USA. China, HK SAR 24%. 4%. Poland 5%. Netherlands 8%. Farm Animal Welfare Compendium Updated Page 5 of 1 0. EU. x In 2016, the EU exported 3,789,753 tonnes of chicken meat. (Source: FAOstat). Table 4: Chicken meat exports from the EU28 countries in 2016. (Source: FAOstat). Chicken meat Share of European chicken Country exports 2016. meat exports 2016 (%). (tonnes). Total 3, 789, 755 Netherlands 1,044,822 Poland 618,388 Belgium 450,240 France 312,827 Germany 305,527 United Kingdom 242,611 Spain 168,507 Italy 101,254 Hungary 100,180 Romania 63,229 Denmark 62,591 Ireland 46,014 Lithuania 44,915 Austria 34,702 Czechia 32,552 Slovakia 28,428 Bulgaria 24,853 Portugal 20,487 Greece 19,019 Slovenia 15,947 Sweden 15,925 Finland 12,873 Latvia 11,628 Estonia 5,706 Croatia 5,578 Cyprus 606 Luxembourg 346 Malta - - Farm Animal Welfare Compendium Updated Page 6 of 1 0.
7 X In 2016, the EU imported 2,549,190 tonnes of chicken meat. (Source: FAOstat). Table 5: Chicken meat imports to EU28 countries in 2016. (Source: FAOstat). Chicken meat Share of European Country imports 2016 chicken meat imports (tonnes) 2016 (%). Total 2,549,189 Germany 447,257 United Kingdom 378,285 France 355,597 Netherlands 274,370 Belgium 150,633 Spain 111,183 Romania 107,825 Czechia 88,979 Bulgaria 84,947 Ireland 77,388 Greece 51,876 Sweden 50,222 Austria 47,702 Slovakia 43,148 Italy 42,336 Denmark 33,824 Portugal 33,544 Lithuania 29,533 Latvia 29,103 Hungary 22,786 Poland 19,226 Estonia 16,904 Croatia 13,382 Slovenia 11,637 Cyprus 10,021 Luxembourg 7,294 Malta 5,202 Finland 4,985 Farm Animal Welfare Compendium Updated Page 7 of 1 0. UK. x In 2017, the UK exported 393,185 tonnes of fresh, frozen and processed poultry meat (including offals). (Source: Agriculture and Horticulture Development Board 2018: IHS Maritime and Trade Global Trade Atlas /HMRC 2018).
8 Table 6: UK fresh and frozen poultry meat exports 2017 by destination (including offals). (Source: Agriculture and Horticulture Development Board 2018: IHS Maritime and Trade Global Trade Atlas /HMRC 2018). UK poultry meat exports 2017 (tonnes). Total exports 344,850. EU28 268,523. Netherlands 101,126. Ireland 32,781. France 28,195. Germany 26,526. Belgium 21,840. Spain 19,729. Poland 8,087. Hong Kong 24,372. South Africa 1,699. x In 2017, the UK imported 822,584 tonnes of fresh, frozen and processed poultry meat (including offals). (Source: (Source: Agriculture and Horticulture Development Board 2018: IHS Maritime and Trade . Global Trade Atlas /HMRC 2018). Table 7: UK fresh and frozen poultry meat imports 2017 by source. (Source: Agriculture and Horticulture Development Board 2018: IHS Maritime and Trade Global Trade Atlas /HMRC 2018). UK poultry meat imports 2017. Total imports 366,462. EU 28 180,975. Netherlands 42,387. Ireland 31,522. Poland 31,371.)
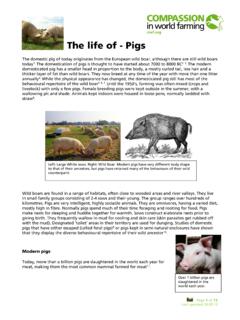
9 Germany 26,213. France 23,949. Belgium 8,095. Thailand 138,182. Brazil 40,684. China 6,002. Farm Animal Welfare Compendium Updated Page 8 of 1 0. Housing systems World x It seems clear that most chicken meat producers follow intensive industrial practices, but we do not have current figures for industrial production at present. x Intensive Broiler housing systems are generally characterized by crowded conditions, fast growing Chickens slaughtered at an early age and vast indoor establishments where Chickens have no access to enrichments or to the outdoors. As a result, factory farmed Broiler chicken welfare is typically very low. (Source: Agribusiness Consulting, ). EU. x The top 5 leading Broiler meat producing countries in the EU are Poland, France, the UK, Germany and Spain. (Source: European Commission, 2016). x EU Broiler Chickens are slaughtered when they reach an average age of 42 days, weighing around One-day old chicks are typically placed within a shed on a floor with a litter covering (including bedding materials such as paper, peat, straw or wood chips).
10 The Chickens remain on the same litter throughout their 42-day life. The litter is then changed after the slaughter of the older Chickens and before the arrival of the next flock of one-day old chicks. (Source: European Commission, 2016). UK. x According to Poultry World, just 11% of UK chicken production is slower growing, meaning that 89% of UK Chickens are produced in fast growing factory farming systems. This is compared to Dutch and French production, whereby 40% and 24% of production is slower growing respectively. (Source: Poultry World, 2019). x Waitrose have recently made a commitment which will benefit over 43 million Chickens every year however, which is almost 4% of UK total production. Although these Chickens are fast growing, they are provided with all the other factors that we consider as higher welfare for Chickens . These Chickens can therefore be considered as non-factory farmed. (Source: Waitrose, 2019). x As a result, we can now comfortably say that the UK produces over 1 billion Chickens each year and over 90% of these are factory farmed.