Example: barber
Support Vector Machines vs Logistic Regression
• Logistic regression focuses on maximizing the probability of the data. The farther the data lies from the separating hyperplane (on the correct side), the happier LR is. • An SVM tries to find the separating hyperplane that maximizes the distance of the closest points to the margin (the support vectors). If a point is not a
Tags:
Information
Domain:
Source:
Link to this page:
Documents from same domain
Fundamentals of Requirements Engineering …
www.cs.toronto.eduFundamentals of Requirements Engineering ... The two engineering disciplines most relevant to this book are software engineering and systems engineering.
Lecture 2 Software Re-engineering - University of …
www.cs.toronto.eduSpring 2005 ECE450H1S Software Engineering II Today … 1. Review SE process 2. Discuss Reengineering Concepts 3. Go over some case studies, a road map to our
Introduction to Operations Research
www.cs.toronto.eduIntroduction to Operations Research Deterministic Models JURAJ STACHO Department of Industrial Engineering and Operations Research
What Is Sound? - University of Toronto
www.cs.toronto.eduWhat Is Sound? Sound is a pressure wave which is created by a vibrating object. This vibrations set particles in the sur-rounding medium (typical air) in

University of Toronto Lecture 7: Why a feasibility …
www.cs.toronto.edu2 University of Toronto Department of Computer Science ©2004-5SteveEasterbrook.Thispresentationisavailablefreefor non-commercialusewithatribution underacreativecommonslicense. 5

Proposed Design of an Inventory ... - University of …
www.cs.toronto.eduProposed Design of an Inventory Database System at Process Research ORTECH System Design Prepared by Andrew Ramadeen Manojav Sridhar Kunendran Deivendran
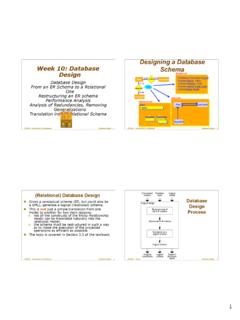
Designing a Database Week 10: Database Schema …
www.cs.toronto.eduOperational DB (OLTP - On-Line Transaction Processing) CSC343 – Introduction to Databases Database Design — 8 ... [CASE = Computer-Aided Software Engineering] CSC343 – Introduction to Databases Database Design — 46 Logical Design witha CASE Tool. Title: 10_DBDesignStG.ppt Author:
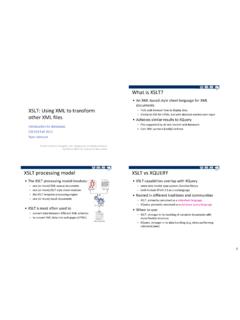
XSLT: Using XML - University of Toronto
www.cs.toronto.edu1 XSLT: Using XML to transform other XML files Introduction to databases CSC343 Fall 2011 Ryan Johnson Thanks to Manos Papagelis, John Mylopoulos, Arnold Rosenbloom
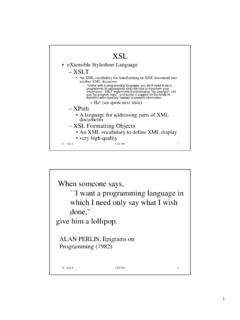
XSL - University of Toronto
www.cs.toronto.edu– XSLT is a language for transforming XML documents into other XML documents – XSLT is designed to be used independently of XSL. • However, XSLT is not intended as a completely general-purpose XML transformation language. • Rather it is designed primarily for the kinds of transformations
CSC340S - Information Systems Analysis and Design
www.cs.toronto.educsc340 Information Systems Analysis and Design page 3/18 b. Using Prototyping tools c. Purchasing a software application package
Related documents

The Basics of Multiple Regression
math.dartmouth.eduwhere wages are measured in natural logs. This is a multiple regression model of wages. Because there is more than one explanatory variable, each parameter is interpreted as a partial derivative, or the change in the dependent variable for a change in the explanatory variable, holding all other variables constant. For example,
Logistic Regression Using SPSS - Miami
sites.education.miami.eduJul 08, 2020 · Logistic Regression Using SPSS Overview Box-Tidwell Test - We include in the model the interactions between the continuous predictors and their logs. - If the interaction term is statistically significant, the original continuous independent variable is not linearly related to the logit of the dependent variable.

INTRODUCTION TO BINARY LOGISTIC REGRESSION
www.asc.ohio-state.eduregression uses the logit transformation to linearize the non-linear relationship between X and the probability of Y. It does this through the use of odds and logarithms. ... negative number. Odds cannot be less than zero, but all odds less than 1 yield natural logs that are negative…the floor is gone. Taking the natural log of the number 1 ...

Dummy-Variable Regression
www.sagepub.comit into the regression equation—say, by taking logs—then there would be a distinction between the explanatory variable (education) and the regressor (log education). In subsequent sections of this chapter, it will transpire that an explanatory variable can give rise to several regressors and

boxcox — Box–Cox regression models
www.stata.com6boxcox— Box–Cox regression models The output is composed of the iteration logs and three distinct tables. The first table contains a standard header for a maximum likelihood estimator and a standard output table for the Box– Cox transform parameters. The second table contains the estimates of the scale-variant parameters.

Logs In Regression - Statistics Department
www-stat.wharton.upenn.eduLogs Transformation in a Regression Equation Logs as the Predictor The interpretation of the slope and intercept in a regression change when the predictor (X) is put on a log scale. In this case, the intercept is the expected value of the response when the predictor is 1, and the slope measures the expected

Lecture 9: Logit/Probit - Columbia University
www.columbia.eduReview of Linear Estimation So far, we know how to handle linear estimation models of the type: Y = β 0 + β 1*X 1 + β 2*X 2 + … + ε≡Xβ+ ε Sometimes we had to transform or add variables to get the equation to be linear: Taking logs of Y and/or the X’s
REGRESSION WITH TIME SERIES VARIABLES
www.ams.sunysb.edu•Regression modelling goal is complicated when the researcher uses time series data since an explanatory variable may influence a dependent variable with a time lag. This often necessitates the inclusion of lags of the explanatory variable in the regression. •If “time” is the unit of analysis we can still regress some dependent