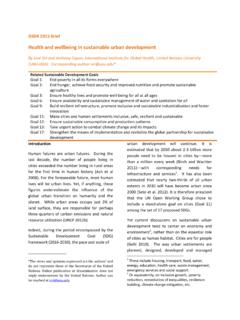
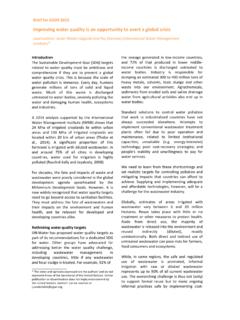
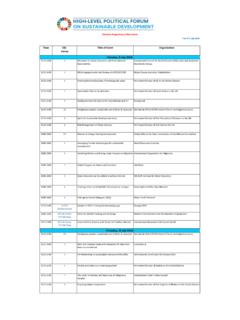
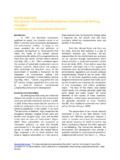
Transcription of Sustainable Development Goals Progress Chart 2020
1 Sustainable Development Goals Progress Chart 20201 Sustainable Development Goals Progress Chart 2020 The Sustainable Development Goals Progress Chart 2020 presents a snapshot of global and regional Progress by the end of 2019. It covers selected targets under the 17 Goals of the 2030 Agenda for Sustainable Development . At the beginning of 2020, the Secretary-General launched the Decade of Action, calling for accelerated solutions by national and local governments, civil society organizations and the private sector to achieve the Sustainable Development Goals by 2030.
2 The Progress Chart shows how far we have come in realizing our commitments, and which areas require urgent attention. It also shows that, for most Goals , the pace of Progress has been insufficient and substantial acceleration is Progress Chart presents two types of information: 1) a trend assessment using stoplight colours and 2) a level of Development assessment based on the latest available data using a gauge meter. The Chart is based on a limited number of indicators and on information available as of May 2020.
3 A baseline year of around 2015 is used for the trend assessment for most indicators. If there are no sufficient empirical data around that time, a baseline year of around 2010 is used. The latest available data for most indicators are from 2018 to 2019; for a few indicators, the data go back to 2015 and 2016. Most of the data used in the Progress Chart were compiled prior to the COVID-19 pandemic, and therefore do not reflect its and targetsWorldSub-Saharan AfricaNorthern Africa and Western AsiaCentral and Southern AsiaEastern and South-Eastern AsiaLatin America and the CaribbeanPacific island countries*Developed countries*Goal 1 | End poverty in all its forms everywhereEradicate extreme poverty for all people everywhere1 Achieve substantial social protection coverage2 Goal 2 | End hunger.
4 Achieve food security and improved nutrition and promote Sustainable agricultureEnsure access by all people to safe, nutritious and sufficient food all year roundBy 2025, achieving a 40 per cent reduction from 2012 in the number of stunted children under 5 years3, 4 Goal 3 | Ensure healthy lives and promote well-being for all at all agesIncrease the coverage of births attended by skilled health personnel3 Reduce under-5 mortality to at least as low as 25 per 1,000 live births32 Goal and targetsWorldSub-Saharan AfricaNorthern Africa and Western AsiaCentral and Southern AsiaEastern and South-Eastern AsiaLatin America and the CaribbeanPacific island countries*Developed countries*End the epidemic of malaria5 Increase diphtheria-tetanus-pertussis vaccine coverage among 1-year-oldsGoal 4 | Ensure inclusive and equitable quality education and promote lifelong opportunities for allEnsure all girls and boys complete primary educationGoal 5 | Achieve gender equality and
5 Empower all women and girlsEliminate child marriage3 Ensure women s full participation and equal opportunities in national parliamentsGoal 6 | Ensure availability and Sustainable management of water and sanitation for allAchieve universal access to safely managed drinking water services3 Achieve universal access to safely managed sanitation services3 Goal 7 | Ensure access to affordable, reliable, Sustainable and modern energy for allAchieve universal access to electricityDouble the global rate of improvement in energy efficiency3, 63 Goal and targetsWorldSub-Saharan AfricaNorthern Africa and Western AsiaCentral and Southern AsiaEastern and South-Eastern AsiaLatin America and the CaribbeanPacific island countries*Developed countries*Goal 8 | Promote sustained, inclusive and Sustainable economic growth.
6 Full and productive employment and decent work for allSustain per capita economic growth7 Achieve full and productive employment for allGoal 9 | Build resilient infrastructure, promote inclusive and Sustainable industrialization and foster innovationSignificantly raise industry s share of GDPS ubstantially increase the expenditure for scientific research and Development as a proportion of GDPI ncrease access to mobile networksGoal 10 | Reduce inequality within and among countriesReduce inequality within countries3, 8 Goal 11 | Make cities and human settlements inclusive, safe.
7 Resilient and sustainableReduce the proportion of urban population living in slumsReduce levels of fine particulate matter in cities3 Goal 12 | Ensure Sustainable consumption and production patternsReduce the domestic material consumption per unit of GDP4 Goal and targetsWorldSub-Saharan AfricaNorthern Africa and Western AsiaCentral and Southern AsiaEastern and South-Eastern AsiaLatin America and the CaribbeanPacific island countries*Developed countries*Rationalize inefficient fossil-fuel subsidies per unit of GDPGoal 13 | Take urgent action to combat climate change and its impactsReduce global greenhouse gas emissions9, 10 Goal 14 | Conserve and sustainably use the oceans, seas and marine resources for Sustainable developmentIncrease the proportion of fish stocks within biologically Sustainable levels9By 2020, conserve at least 10 per cent of coastal and marine areasGoal 15 | Protect, restore and promote Sustainable use of terrestrial ecosystems, sustainably manage forests, combat desertification.
8 And halt and reverse land degradation and halt biodiversity lossBy 2020, ensure the conservation, restoration and Sustainable use of terrestrial ecosystemsBy 2020, protect and prevent the extinction of threatened species11 Goal 16 | Promote peaceful and inclusive societies for Sustainable Development , provide access to justice for all and build effective, accountable and inclusive institutions at all levelsSignificantly reduce homicide rates12 Reduce the proportion of unsentenced detainees12 Increase the proportion of countries with independent national human rights institutions in compliance with the Paris Principles5 Goal and targetsWorldSub-Saharan AfricaNorthern Africa and Western AsiaCentral and Southern AsiaEastern and South-Eastern AsiaLatin America and the CaribbeanPacific island countries*Developed countries*Goal 17 | Strengthen the means of
9 Implementation and revitalize the global Partnership for Sustainable DevelopmentEnsure full implementation of the net official Development assistance disbursements by donor countries9 Enhance access to technology by increasing internet useIncrease proportion of countries with a national statistical plan that is fully funded13 LegendTrend (colour and arrow, arrowhead)Current levelSubstantial Progress /on trackLimited or no progressTarget met or almost metClose to targetModerate distance to targetFar from targetVer y far from targetInsufficient dataFair Progress but acceleration neededDeteriorationNotes* The category Pacific island countries refers to Oceania excluding Australia and New Zealand.
10 The category developed countries includes Europe, Northern America, Australia and New Trend assessment for the world is based on 2015 global estimates and 2018 nowcast data. For other regions, the trend assessment is based on regional estimates using empirical data from countries for 2015 2018. For sub-Saharan Africa, only level assessment is available based on 2015 Data are available for 2016 Trend assessment uses a baseline year around Level assessment is based on the level of stunting prevalence.
