Transcription of Synthesis Report Summary for Policymakers Chapter
1 ChapterClimate change 2014 Synthesis Report Summary for Policymakers Summary for Policymakers2 SPMI ntroductionThis Synthesis Report is based on the reports of the three Working Groups of the intergovernmental Panel on climate change (IPCC), including relevant Special Reports. It provides an integrated view of climate change as the final part of the IPCC s Fifth Assessment Report (AR5).This Summary follows the structure of the longer Report which addresses the following topics: Observed changes and their causes; Future climate change , risks and impacts; Future pathways for adaptation, mitigation and sustainable development; Adaptation and the Synthesis Report , the certainty in key assessment findings is communicated as in the Working Group Reports and Special Reports.
2 It is based on the author teams evaluations of underlying scientific understanding and is expressed as a qualitative level of confidence (from very low to very high) and, when possible, probabilistically with a quantified likelihood (from exceptionally unlikely to virtually certain)1. Where appropriate, findings are also formulated as statements of fact with-out using uncertainty Report includes information relevant to Article 2 of the United Nations Framework Convention on climate change (UNFCCC).SPM 1. Observed Changes and their CausesHuman influence on the climate system is clear, and recent anthropogenic emissions of green-house gases are the highest in history.
3 Recent climate changes have had widespread impacts on human and natural systems. {1}SPM Observed changes in the climate systemWarming of the climate system is unequivocal, and since the 1950s, many of the observed changes are unprecedented over decades to millennia. The atmosphere and ocean have warmed, the amounts of snow and ice have diminished, and sea level has risen. { }Each of the last three decades has been successively warmer at the Earth s surface than any preceding decade since 1850. The period from 1983 to 2012 was likely the warmest 30-year period of the last 1400 years in the Northern Hemisphere, where such assessment is possible (medium confidence).
4 The globally averaged combined land and ocean surface temperature data as calculated by a linear trend show a warming of [ to ] C 2 over the period 1880 to 2012, when multiple independently produced datasets exist (Figure ). { , Figure }In addition to robust multi-decadal warming, the globally averaged surface temperature exhibits substantial decadal and interannual variability (Figure ). Due to this natural variability, trends based on short records are very sensitive to the beginning and end dates and do not in general reflect long-term climate trends.
5 As one example, the rate of warming over 1 Each finding is grounded in an evaluation of underlying evidence and agreement. In many cases, a Synthesis of evidence and agreement supports an assignment of confidence. The Summary terms for evidence are: limited, medium or robust. For agreement, they are low, medium or high. A level of confidence is expressed using five qualifiers: very low, low, medium, high and very high, and typeset in italics, , medium confidence. The follow-ing terms have been used to indicate the assessed likelihood of an outcome or a result: virtually certain 99 100% probability, very likely 90 100%, likely 66 100%, about as likely as not 33 66%, unlikely 0 33%, very unlikely 0 10%, exceptionally unlikely 0 1%.
6 Additional terms (extremely likely 95 100%, more likely than not >50 100%, more unlikely than likely 0 <50%, extremely unlikely 0 5%) may also be used when appropriate. Assessed likelihood is typeset in italics, , very likely. See for more details: Mastrandrea, , Field, Stocker, O. Edenhofer, Ebi, Frame, H. Held, E. Kriegler, Mach, Matschoss, Plattner, Yohe and Zwiers, 2010: Guidance Note for Lead Authors of the IPCC Fifth Assess-ment Report on Consistent Treatment of Uncertainties, intergovernmental Panel on climate change (IPCC), Geneva, Switzerland, 4 Ranges in square brackets or following are expected to have a 90% likelihood of including the value that is being estimated, unless otherwise stated.
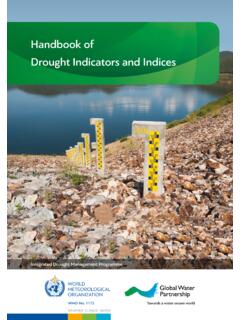
7 Summary for Policymakers3 SPM 1 ( C)Globally averaged combined land and ocean surface temperature anomaly 1850190019502000 Year (m)Globally averaged sea level change (b)1850190019502000 Year(GtCO2/yr) 0510152025303540 Fossil fuels, cement and flaringForestry and other land use1850190019502000 Year80010001200140016001800CH4 (ppb)270280290300310320330N2O (ppb)280300320340360380400CO2 (ppm)1850190019502000 Year05001000150020001750 19701750 2011 Cumulative CO2 emissions(GtCO2)(a)(c)(d)Globally averaged greenhouse gas concentrationsGlobal anthropogenic CO2 emissionsQuantitative information of CH4 and N2O emission time series from 1850 to 1970 is limited Figure | The complex relationship between the observations ( panels a, b, c, yellow background) and the emissions (panel d, light blue background) is addressed in Section and Topic 1.
8 Observations and other indicators of a changing global climate system. Observa-tions: (a) Annually and globally averaged combined land and ocean surface temperature anomalies relative to the average over the period 1986 to 2005. Colours indicate different data sets. (b) Annually and globally averaged sea level change relative to the average over the period 1986 to 2005 in the longest-running dataset. Colours indicate different data sets. All datasets are aligned to have the same value in 1993, the first year of satellite altimetry data (red). Where assessed, uncertainties are indicated by coloured shading.
9 (c) Atmospheric concentrations of the greenhouse gases carbon dioxide (CO2, green), methane (CH4, orange) and nitrous oxide (N2O, red) determined from ice core data (dots) and from direct atmospheric measurements (lines). Indicators: (d) Global anthropogenic CO2 emissions from forestry and other land use as well as from burning of fossil fuel, cement production and flaring. Cumulative emissions of CO2 from these sources and their uncertainties are shown as bars and whiskers, respectively, on the right hand side. The global effects of the accumulation of CH4 and N2O emissions are shown in panel c.
10 Greenhouse gas emission data from 1970 to 2010 are shown in Figure {Figures , , } Summary for Policymakers4 SPMthe past 15 years (1998 2012; [ to ] C per decade), which begins with a strong El Ni o, is smaller than the rate calculated since 1951 (1951 2012; [ to ] C per decade). { , Box }Ocean warming dominates the increase in energy stored in the climate system, accounting for more than 90% of the energy accumulated between 1971 and 2010 (high confidence), with only about 1% stored in the atmosphere. On a global scale, the ocean warming is largest near the surface, and the upper 75 m warmed by [ to ] C per decade over the period 1971 to 2010.