Transcription of t-Tests, Chi-squares, Phi, Correlations: It’s all the same ...
1 Newsom Psy 521/621 Univariate Quantitative Methods, Fall 2022 1 t- tests , Chi-squares, Phi, Correlations: It s all the same stuff In this handout, I provide illustrations of the connection between t- tests and correlations and between chi-square and correlation. Correlation equivalents Correlation is a statistic that describes the association between two variables. The correlation statistic can be used for continuous variables or binary variables or a combination of continuous and binary variables. In contrast, t- tests examine whether there are significant differences between two group means.
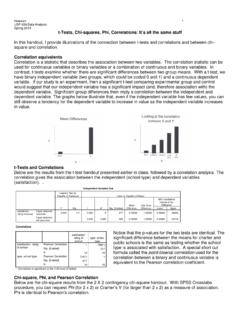
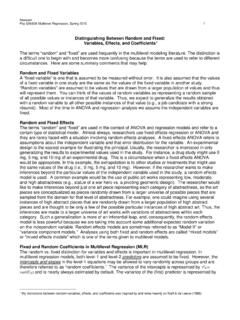
2 With a t-test, we have binary independent variable (two groups, which could be coded 0 and 1) and a continuous dependent variable. If our study is an experiment, then a significant t-test comparing experimental group and control would suggest that our independent variable has a significant impact (and, therefore association with) the dependent variable. Significant group differences then imply a correlation between the independent and dependent variable. The graphs below illustrate that, even if the independent variable has few values, you can still observe a tendency for the dependent variable to increase in value as the independent variable increases in value.
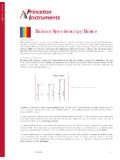
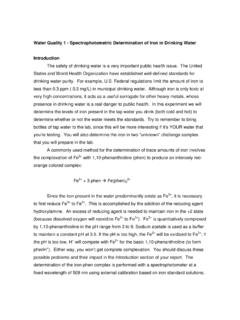
3 T- tests and Correlations Below are the results from the t-test handout presented earlier in class, followed by a correlation analysis. The correlation gives the association between the independent (school type) and dependent variables (satisfaction). Notice that the p-values for the two tests are identical. The significant difference between the means for charter and public schools is the same as testing whether the school type is associated with satisfaction. A special shortcut formula called the point-biserial correlation used for the correlation between a binary and continuous variable is equivalent to the Pearson correlation coefficient.
4 Chi-square, Phi, and Pearson Correlation Below are the chi-square results from the 2 2 contingency chi-square handout. With SPSS Crosstabs procedure, you can request Phi (for 2 2) or Cramer s V (for larger than 2 2) as a measure of association. Phi is identical to Pearson s correlation. Independent Samples variancesassumedEqual variancesnot assumedsatisfaction rating of 's Test forEquality of VariancestdfSig. (2-tailed)MeanDifferenceStd. ErrorDifferenceLowerUpper95% ConfidenceInterval of theDifferencet-test for Equality of MeansCorrelations satisfaction rating of school type school type satisfaction rating of school Pearson Correlation 1.
5 728(*) Sig. (2-tailed) .017 N 10 10 type school type Pearson Correlation .728(*) 1 Sig. (2-tailed) .017 N 10 10 * Correlation is significant at the level (2-tailed). Newsom Psy 521/621 Univariate Quantitative Methods, Fall 2022 2 The significance tests for chi-square and correlation will not be exactly the same but will very often give the same statistical conclusion. Chi-square tests are based on the normal distribution (remember that z2 = 2), but the significance test for correlation uses the t-distribution. With large sample sizes ( , N > 120) the t and the normal z-distributions will be the same (or, at least, extremely close).
6 1 Correlation and Spearman's Rank-Order Correlation (Rho) A third type of correlation equivalent is one that is named for a correlation between two sets of ranks. For example, if I had 20 products lined up and I asked you to rank them from 1 to 20. I could then examine how these ranks were related to another set of ranks, say for a second type of product. The association between the two sets of rank scores is described by the Spearman's rho. Notice the correlation coefficient and the p-value are exactly the same for the two analyses (Pearson s correlation on the left and Spearman s rho on the right).
7 1 This "approximate significance" is reported by most researchers regardless of the sample size. Perhaps this is because, for smaller sample sizes, there are not any simple recommendations. There does not seem to be much consensus in favor of the Yates continuity correction, and the fisher exact test, which is more powerful, depends on assumption that the marginal frequencies are fixed (determined values as in an experiment).