Transcription of Table 7 - WHO
1 World HealtH StatiSticS 2009107 Health expenditureGlobally in 2006, expenditure on health was about of gross domestic product, with the highest level in the Americas at and the lowest in the South-East Asia Region at This translates to about US$ 716 per capita on the average but there is tremendous variation ranging from a very low US$ 31 per capita in the South-East Asia Region to a high of US$ 2636 per capita in the Americas. The share of government in health spending varies from 76% in Europe to 34% in South-East Asia. Where government expenditure in health is low, the shortfall is made up in low-income countries by private spending, about 85% of which is out of pocket.
2 This means that payment is made at the point of accessing health services. Such payment does not allow for pooling of risks and leads to a high probability of catastrophic payments that can result in poverty for the household. External resources are becoming a major source of health funding in low-income countries. From a share of 12% of total health expenditure in 2000, external resources represented 17% of low-income country health expenditure in 2006. Some low-income countries have two thirds of their total health expenditure funded by external resources. In these situations, predictability of aid is an important concern.
3 These data are generated from sources that WHO has been collecting for over 10 years. The most comprehensive and consistent data on health financing are generated from national health accounts that collect expenditure information within an internationally recognized framework. National health accounts trace the financing as it flows from sources which provide the funds to agents who decide on the use of the funds to providers and beneficiaries of health services. Not all countries have or update national health accounts and, in these instances, data are obtained through technical contacts in country or from publicly available documents and reports.
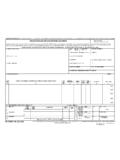
4 Missing values are estimated using various accounting techniques depending on the data available for each country. WHO sends all such estimates to the respective ministries of health every year for 71087. Health expenditureMember StateHealth expenditure ratios aTotal expenditure on health as % of gross domestic productGeneral government expenditure on health as % of total expenditure on health bPrivate expenditure on health as % of total expenditure on health bGeneral government expenditure on health as % of total government expenditureExternal resources for health as % of total expenditure on health2000200620002006200020062000200620 002006 Afghanistand,e, and and , African Islandsi, te d' People's Republic of Koread,i.
5 Republic of the Health expenditure109 World HealtH StatiSticS 2009 Table 7 Health expenditure ratios aHealth expenditure per capita aSocial security expenditure on health as % of general government expenditure on healthOut-of-pocket expenditure as % of private expenditure on healthPrivate prepaid plans as % of private expenditure on health Per capita total expenditure on health at average exchange rate (US$) Per capita total expenditure on health c (PPP int. $)Per capita government expenditure on health at average exchange rate (US$) Per capita government expenditure on health c (PPP int. $) 6 91<1 75 187 239 381 27 70 87 63 148 188 315 46 120 138 1 284 2 822 1 905 2 980 835 1 987 1 239 2 16 71 56 115 13 62 44 412 517 599 823 285 348 413 689 551 814 1 205 382 251 451 40 98 130 226 7 41 23 1 734 3 302 2 271 3 119 1 164 2 237 1 524 2 2 364 3 974 2 858 3 608 1 816 3 014 2 196 2 31 102 104 254 6 27 19 1 078 1 419 1 361 1 872 513 691 648 488 788 329 537 11 12 27 37 3 4 7 557 774 916 1 208 365 490 601 66 243 328 623 51 182 251 2 062 3 726 13 4 1 480 2 701 9 153 205 229 332
6 74 112 110 15 26 50 61 7 13 24 42 49 132 140 31 36 97 61 79 192 257 37 49 115 93 296 282 616 48 163 146 154 379 374 815 98 290 238 267 427 506 674 107 204 202 443 571 1 036 941 370 460 865 96 297 377 744 57 169 222 11 27 41 73 4 15 16 4 10 12 31 1 1 2 17 30 51 96 4 8 12 27 45 75 94 6 10 17 2 080 3 917 2 514 3 673 1 465 2 759 1 770 2 55 112 97 139 41 88 72 10 14 25 27 4 5 10 10 29 49 72 4 16 21 302 473 572 689 147 249 278 44 94 109 216 17 38 42 154 217 370 464 124 185 300 8 16 21 27 4 9 11 21 44 56 74 12 31 33 196 566 436 810 177 517 395 265 402 467 779 204 275 359 33 35 84 63 8 8 21 375 790 839 1 169 323 680 723 1 183 362 353 674 167 332 321 749 1 459 1 973 2 754 311 653 820 1 361 953 980 1 511 326 839 885 1 16<1 1 1 14<1 1 10 10 8 19<1 2<1 2 479 5 447 2 379 3 773 2 044 4 677 1 961 3 44 63 90 133 30 47 61 981107.
7 Health expenditureMember StateHealth expenditure ratios aTotal expenditure on health as % of gross domestic productGeneral government expenditure on health as % of total expenditure on health bPrivate expenditure on health as % of total expenditure on health bGeneral government expenditure on health as % of total government expenditureExternal resources for health as % of total expenditure on (Islamic Republic of) ,i, People's Democratic Arab Health expenditure111 World HealtH StatiSticS 2009 Table 7 Health expenditure ratios aHealth expenditure per capita aSocial security expenditure on health as % of general government expenditure on healthOut-of-pocket expenditure as % of private expenditure on healthPrivate prepaid plans as % of private expenditure on health Per capita total expenditure on health at average exchange rate (US$) Per capita total expenditure on health c (PPP int.)
8 $)Per capita government expenditure on health at average exchange rate (US$) Per capita government expenditure on health c (PPP int. $) 235 275 387 487 162 173 267 172 206 333 379 59 76 115 54 166 202 379 17 73 63 82 92 208 320 33 38 84 169 181 351 360 77 112 159 51 440 160 633 26 353 81 9 8 33 19 5 4 16 219 632 521 958 169 464 404 5 7 19 26 3 4 10 98 139 160 164 68 97 110 1 639 3 232 1 794 2 656 1 203 2 455 1 316 2 2 193 3 937 2 542 3 420 1 740 3 139 2 018 2 193 351 552 628 131 256 375 13 15 39 57 6 9 18 48 147 153 337 8 32 26 2 371 3 718 2 670 3 465 1 890 2 858 2 127 2 18 33 65 76 7 11 27 919 2 280 1 449 2
9 547 551 1 414 869 1 261 333 388 485 179 212 265 95 143 218 267 38 54 87 20 20 47 65 2 3 6 11 12 34 29 2 3 5 53 72 116 144 45 62 98 26 42 61 89 10 29 25 62 99 138 226 35 47 77 326 929 852 1 492 231 659 602 1 2 940 4 994 2 738 3 207 2 383 4 093 2 219 2 19 29 63 86 4 7 14 12 39 37 82 5 20 14 65 215 387 678 24 109 143 18 62 84 146 5 49 23 1 723 3 871 1 950 3 106 1 267 3 030 1 434 2 1 557 1 675 1 845 2 034 978 938 1 159 1 1 547 2 813 2 061 2 631 1 122 2 172 1 495 2 189 180 313 307 99 95 164 2 827 2 759 1 967 2 581 2 298 2 242 1 598 2 166 238 302 435 77 103 141 51 190 198 352 26 122 101 18 29 51 67 9 14 25 70 121 154 230 61 105 135 523 803 903 956 408 628 705 13 35 62 115 6 15 27 11 24 41 80 3 4 13 197 582 456 1 018 107 345 248 485 494 801 859 145 219 240 28 51 65 98 14 30 33 7 7 14 15 1 2 3 237 219 385 355 146 145 238 212 547 543 981 148 383 378 2 708 6 506 3 137 5 494 2 418 5 912 2 800 4 9921127.
10 Health expenditureMember StateHealth expenditure ratios aTotal expenditure on health as % of gross domestic productGeneral government expenditure on health as % of total expenditure on health bPrivate expenditure on health as % of total expenditure on health bGeneral government expenditure on health as % of total government expenditureExternal resources for health as % of total expenditure on (Federated States of) , New of of Kitts and Vincent and the Tome and Health expenditure113 World HealtH StatiSticS 2009 Table 7 Health expenditure ratios aHealth expenditure per capita aSocial security expenditure on health as % of general government expenditure on healthOut-of-pocket expenditure as % of private expenditure on healthPrivate prepaid plans as % of private expenditure on health Per capita total expenditure on health at average exchange rate (US$) Per capita total expenditure on health c (PPP int.)