Transcription of Target Annual Report
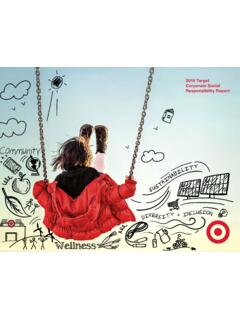
1 TargetAnnualReportBeauty & HouseholdEssentialsFood & BeverageHome Furnishings& D corApparel &AccessoriesHardlines 14 15 16 17 18 192019 Growth: CAGR: 14 15 16 17 18 192019 Growth: CAGR: 14 15 16 17 18 192019 Growth: CAGR: 14 15 16 17 18 192019 Growth: CAGR: 27%19%19%19%16%$72 ,618$74,494$70,271$ 72 ,714$75,356$ 7 8 ,112$4,535$4,878$4,864$4,224$ 4 ,11 0$ 4,658$2,449$3,321$2,666$2,908$2,930$3,26 9$ $ $ $ $ $ explore key stories of the past year and find out what s ahead, visit You can view our Annual Report online at 2019 Sales: $77,130 MillionFinancial Highlights(Note: Reflects amounts attributable to continuing operations. 2017 was a 53-week year.)To t a l R e v e n u eIn MillionsOperating IncomeIn MillionsNet EarningsIn MillionsDiluted EPS Welcome to our 2019 Annual ReportBy any measure, 2019 was an exceptional year for the Target team.
2 It s a year that stands on its own, and a glance through this Report will demonstrate why. But looking back on it now, what really stands out to me is how 2019 prepared Target for this extraordinary moment we re all navigating together, as our team, guests and communities respond to I would provide a detailed recap of our previous year s results in this letter. In this unprecedented moment, that doesn t feel right. On one hand, we re focused entirely on the immediate needs of our team and guests. At the same time, I m more aware and appreciative than ever of the enduring attributes that will help us all move safely beyond this crisis. At Target , our strategy is an expression of our purpose and values. For years, we ve invested to make our proximity to guests work even harder for them. That meant adding brands, fulfillment capabilities and expert service to our nearly 1,900 neighborhood stores, and moving into additional neighborhoods every year.
3 It meant a constant drive to curate the right mix of products across our multi-category assortment. We remained convinced, sometimes against conventional thinking, that stores would continue to matter to our guests, whether they shopped online or in-person. While it had long been evident in our culture, we formally articulated our purpose a few years ago: To help all families discover the joy of everyday life. Today, with the coronavirus outbreak, everyday life has started to look different for everyone and our guests have turned to us more than they needed to stock up for their families, they came to Target . When they wanted items right away, they looked to us for same-day pickup or delivery. When families were anxious to minimize trips, they found comfort and confidence in a familiar and friendly place for food, medicine and essentials, but also office supplies and technology to work from home, school items for distance learning, and games, puzzles, electronics and comfort-wear for long weeks in quarantine.
4 In the best of times, our team meets the world with optimism, inclusivity, connection, inspiration and drive. In the hardest days of this crisis, those values never wavered. So, while I know there s a lot of work ahead to put this chapter behind us, I also know the Target team will remain steadfast. Our financial strength gives us the ability to keep investing in our team and to shift quickly in response to guest needs. And the same values that have made Target a trusted brand and community resource for decades will be a source of continuity and calm as we all pull together for each other and for a future that will certainly be brighter than recent days. Sincerely,Brian Cornell, Chairman and CEOL etter to ShareholdersFinancial Summary 2017 2016 2015 2019 2018 As Adjusted (a) As Adjusted As Adjusted (b)FINANCIAL RESULTS (in millions) Sales (c) $ 77,130 $ 74,433 $ 71,786 $ 69,414 $ 73,717 Other revenue 982 923 928 857 777 Total revenue 78,112 75,356 72,714 70,271 74,494 Cost of Sales 54,864 53,299 51,125 49,145 52,241 Selling, general and administrative expenses (SG&A) 16,233 15,723 15,140 14,217 15,406 Depreciation and amortization (exclusive of depreciation included in cost of sales) 2,357 2,224 2,225 2,045 1,969 Operating income 4,658 4,110 4,224 4,864 4,878 Net interest expense (d)
5 477 461 653 991 607 Net other (income) / expense (e) (9) (27) (59) (88) (652)Earnings from continuing operations before income taxes 4,190 3,676 3,630 3,961 4,923 Provision for income taxes (f) 921 746 722 1,295 1,602 Net earnings from continuing operations 3,269 2,930 2,908 2,666 3,321 Discontinued operations, net of tax 12 7 6 68 42 Net earnings $ 3,281 $ 2,937 $ 2,914 $ 2,734 $ 3,363 PER SHAREB asic earnings per share Continuing operations $ $ $ $ $ Discontinued operations earnings per share $ $ $ $ $ earnings per share Continuing operations $ $ $ $ $ Discontinued operations earnings per share $ $ $ $ $ dividends declared $ $ $ $ $ POSITION (in millions) Total assets $ 42,779 $ 41,290 $ 40,303 $ 38,724 $ 40,262 Capital expenditures $ 3,027 $ 3,516 $ 2,533 $ 1,547 $ 1,438 Long-term debt, including current portion $ 11,499 $ 11,275 $ 11,398 $ 12,591 $ 12,760 Net debt (g) $ 9,689 $ 10,506 $ 10,267 $ 11,481 $ 9,752 Shareholders investment $ 11,833 $ 11,297 $ 11,651 $ 10,915 $ 12,957 FINANCIAL RATIOS Comparable sales growth (h) ( )
6 % margin (% of sales) expenses (% of total revenue) income margin (% of total revenue) shares outstanding (in millions) cash flow provided by continuing operations (in millions) $ 7,099 $ 5,970 $ 6,861 $ 5,337 $ 5,254 Revenue per square foot (i) $ 326 $ 314 $ 298 $ 293 $ 310 Retail square feet (in thousands) 240,516 239,581 239,355 239,502 239,539 Square footage growth ( )% % ( )%Total number of stores 1,868 1,844 1,822 1,802 1,792 Total number of distribution centers 42 40 41 40 40(a) Consisted of 53 weeks.
7 (b) The financial summary data for fiscal year 2015 does not reflect adoption of Accounting Standards Update (ASU) No. 2016-02 Leases (Topic 842).(c) The 2016 sales decline is primarily due to the December 2015 sale of our pharmacy and clinic businesses (Pharmacy Transaction) to CVS Pharmacy, Inc. 2015 sales includes $3,815 million related to our former pharmacy and clinic businesses.(d) Includes losses on early retirement of debt of $10 million, $123 million, and $422 million for 2019, 2017, and 2016, respectively.(e) For 2015, includes the gain on the sale of our pharmacy and clinic businesses.(f) For 2018 and 2017, includes $36 million and $343 million, respectively, of discrete tax benefits related to the Tax Cuts and Jobs Act of 2017.(g) Including current portion of long-term debt and other borrowings, net of short-term investments of $1,810 million, $769 million, $1,131 million, $1,110 million, and $3,008 million in 2019, 2018, 2017, 2016, and 2015, respectively.
8 Management believes this measure is an indicator of our level of financial leverage because short-term investments are available to pay debt maturity obligations. For 2017 and earlier, only short-term investments held by entities were used to calculate net debt because amounts held by entities located outside the were restricted for use.(h) See definition of comparable sales in Form 10-K, Item 7, Management s Discussion and Analysis of Financial Condition and Results of Operations.(i) Represents revenue per square foot which is calculated using rolling four quarters average square feet. In 2017, revenue per square foot was calculated excluding the 53rd week in order to provide a more useful comparison to other years. Using total reported revenue for 2017 (including the 53rd week) resulted in revenue per square foot of $303. The 2016 decrease is primarily due to the Pharmacy Transaction.
9 Our former pharmacy and clinic businesses contributed approximately $16 to 2015 revenue per square foot . UNITED STATESSECURITIES AND EXCHANGE COMMISSIONW ashington, 20549 FORM 10-K(Mark One) Annual Report PURSUANT TO SECTION 13 OR 15(d) OF THE SECURITIES EXCHANGE ACT OF 1934 For the fiscal year ended February 1, 2020 OR TRANSITION Report PURSUANT TO SECTION 13 OR 15(d) OF THE SECURITIES EXCHANGE ACT OF 1934 For the transition period from ____ to ____Commission File Number 1-6049 Target CORPORATION(Exact name of registrant as specified in its charter) Minnesota 41-0215170(State or other jurisdiction of incorporation or organization)( Employer Identification No.) 1000 Nicollet Mall, Minneapolis, Minnesota 55403 (Address of principal executive offices) (Zip Code)Registrant s telephone number, including area code: 612/304-6073 Former name, former address and former fiscal year, if changed since last Report : N/ASecurities registered pursuant to Section 12(b) of the Securities Exchange Act of 1934:Title of each classTrading Symbol(s)Name of each exchange on which registeredCommon stock, par value $ per shareTGTNew York Stock ExchangeSecurities registered pursuant to Section 12(g) of the Act: NoneIndicate by check mark if the registrant is a well-known seasoned issuer, as defined in Rule 405 of the SecuritiesAct.
10 Yes x No oIndicate by check mark if the registrant is not required to file reports pursuant to Section 13 or Section 15(d) of the Act. YesoNoxNote Checking the box above will not relieve any registrant required to file reports pursuant to Section 13 or 15(d) of the Exchange Act fromtheir obligations under those by check mark whether the registrant (1) has filed all reports required to be filed by Section 13 or 15(d) of the Securities Exchange Act of1934 during the preceding 12 months (or for such shorter period that the registrant was required to file such reports), and (2) has been subject tosuch filing requirements for the past 90 days. Yes xNo oIndicate by check mark whether the registrant has submitted electronically every Interactive Data File required to be submitted pursuant toRule 405 of Regulation S-T ( of this chapter) during the preceding 12 months (or for such shorter period that the registrant was requiredto submit such files).