Transcription of Teaching guide: models, theories and frameworks handbook
1 Models, theories and frameworks handbookA-LEVEL BUSINESSThe A-level business specification includes a number of theories and models which have been included to help teachers by providing a framework for use when Teaching the different topics. The following is an overview of the various theories or models along with guidance as to how they can be used to support learning. Use this Teaching guide in the classroom to engage your students, contextualise the models/ theories in real-world business and prepare them for the , theories and frameworks handbook : A-level BusinessContentsTannenbaum Schmidt Continuum 6 Blake Mouton Grid 8 Scientific decision making 10 Decision trees 12 Stakeholder mapping 14 Market mapping 16 Price elasticity of demand 18 Income elasticity of demand 21 STP segmentation, targeting, positioning 237Ps of the marketing mix 25 Boston Matrix 27 The product life cycle 29 Inventory control chart 32 Hackman and Oldham s model of job design 34 Motivation 36 SWOT analysis 40 Kaplan and Norton s balanced scorecard model 42 Elkington s Triple Bottom Line 44 Carroll s Corporate Social Responsibility Pyramid 464 Porter s five forces 48 Investment appraisal 50 Sensitivity analysis 57 Ansoff matrix model 58 Porter s strategies 60 Bowman s strategic clock 62 Greiner s model of growth 64 Bartlett and Ghoshal s international, multi-domestic.
2 Transnational and global strategies 67 Lewin s force field analysis 70 Kotter and Schlesinger s reasons for resistance to change 72 Kotter and Schlesinger s model of overcoming resistance to change 74 Handy s culture 76 Hofstede s national cultures 78 Network analysis 80 Strategic drift 825 Models, theories and frameworks handbook : A-level BusinessTannenbaum Schmidt ContinuumOverviewA model that highlights the range of different management styles that may be adopted ranging from a tell approach to one that involves makes decision and announces itBoss-centred leadershipSubordinate-centred leadershipUse of authority by the managerArea of freedom for subordinatesManager sells decisionManager presents ideas and invites questionsManager presents tentative decision subject to changeManager presents problem, gets suggestions, makes decisionManager defines limits: asks group to make decisionManager permits subordinates to function within limits defined by superiorKey pointsThe model highlights that there are a range of styles rather than categorising management and leadership simply in terms of either authoritarian and democratic.
3 It shows that there is a you can use thisWhen discussing the influences on and impact of different management and leadership styles you might want to consider: the advantages and disadvantages of each approach the factors that determine what style is adopted by a manager/leader when a given style might be appropriate eg you might consider how different styles might be appropriate in different situations or when making different types of Understanding management, leadership and decision making7 Models, theories and frameworks handbook : A-level BusinessBlake Mouton GridOverviewA model that highlights different management styles, according to their focus on the task and the people within the of the roadCountry clubImpoverishedProduce or perishTe a m leaderLowHighLowHighConcern for peopleConcern for the taskKey pointsThe model highlights that there are different management or leadership styles: some managers focus on the task; some on the people in their team; some are not interested in either task or people.
4 Some gain the commitment of people to the you can use thisWhen discussing the influences on and impact on different management and leadership styles you might want to consider: the advantages and disadvantages of each approach the factors that determine what style is adopted by a Understanding management, leadership and decision making9 Models, theories and frameworks handbook : A-level BusinessScientific decision makingOverviewA model that highlights the different stages in a scientific, data based approach to decision making. It outlines a logical sequential objectivesAnalyse dataReviewImplementSelectGather dataKey pointsThis model takes a logical and rational approach to decision making with a series of stages that follow on from each other. Decisions need to be reviewed and this might lead to a change in you can use thisWhen discussing management, leadership and decision making you might want to consider: the importance of objectives; all decisions have to be judged against the objectives the value of data (and this could lead to a discussion on what influences the reliability of data) in decision making; poor data may lead to poor decision making the need to make choices (and then discuss eg opportunity cost, risk, rewards) the importance of implementation good management is not just making the right decision but also ensuring it is implemented effectively whether, in reality, decision making is this logical and whether the process is iterative eg having gathered data do we review the objectives and possibly change them?
5 Having selected a course of action do we sometimes have to go back and gather more data to check it is the right decision? you might consider why decisions go wrong. You could consider each of the stages of the process and consider the possible problems at each Understanding management decision makingSection Understanding management decision making11 Models, theories and frameworks handbook : A-level BusinessDecision treesOverviewProvides an example of scientific decision new product( 5m)( 1m)( 3m)( )( 8m)( 30m) existing productKey points A square represents that a decision has to be made. The lines coming from the square represent the possible choices. The circles show that there are outcomes as a result of a choice. The lines coming from a circle show the expected outcomes. The probability shows the estimated likelihood of a given outcome. The probability of all outcomes must add up to The Expected Value (EV) shows the weighted average of a given choice; to calculate this multiply the probability of each given outcome by its expected value and add them together eg EV Launch new product = [ x 30] + [ x -8] = 12 - = The Expected Value is the average outcome if this decision was made many times.
6 The Net Gain is the Expected Value minus the initial cost of a given choice. Net Gain of launching new product = - 5m= To compare this Net Gain with the Net Gain of other choices, eg Net Gain of Modify existing product = [ x 3] + [ x ] = -1 = Decision based on choice with highest net gain which is to launch new product [ as against ].When you can use thisWhen discussing important concepts in decision making such as choices, opportunity cost, probability and risk, costs and returns, net gains, expected outcomes and forecasting you could consider: the value of decision trees in getting managers to think through their options, the probability of different outcomes and the financial consequences the extent to which the financial consequences of an outcome can be accurately estimated and whether outcomes are best measured in financial terms issues could be considered in decision making such as raising the initial finance, the impact of ethics and the impact on Understanding management decision making13 Models, theories and frameworks handbook .
7 A-level BusinessStakeholder mappingOverviewCategorises stakeholders in terms of their relative power and satisfiedManage closelyMonitor (minimum effort)Keep informedLowHighLowHighStakeholder powerStakeholder interestKey pointsHighlights that not all stakeholders are equal they vary in terms of power and influence. This might affect the way a business communicates with different groups and how much attention is paid to their you can use thisWhen discussing the power and influence of stakeholders, how stakeholders may affect decision making and how managers may treat different groups you might want to consider: the factors that affect the power and influence of different stakeholder groups how a business might treat different groups according to their power and interest (eg how much information they provide) how stakeholders might increase their power (eg employees coming together in a trade union).
8 Section Understanding the role and importance of stakeholders15 Models, theories and frameworks handbook : A-level BusinessMarket mappingOverviewIdentifies how products/brands are perceived by customers relative to other products/brands in the priceHigh priceInnovativeConservativeKey pointsHighlights that there are various criteria used by customers to judge products, eg price v quality, narrow range of products v wide range, traditional v modern. The appropriate criteria will depend on the market and how customers assess these products, eg modern v traditional, premium v you can use thisWhen discussing the positioning of a product/brand. Marketing managers must analyse a market to understand what segments exist within a market, then decide which to target, and how best to position the product in the market relative to might want to consider: the different criteria customers use to assess products what factors might influence the positioning a business chooses the implication for other functional areas of choosing a particular positioning why a business might want to move from one position to Understanding markets and customers17 Models, theories and frameworks handbook : A-level BusinessPrice elasticity of demandModel/theoryThe value of price elasticity is of interest to managers because: it influences pricing decisions if demand is price elastic this means it is sensitive to price.
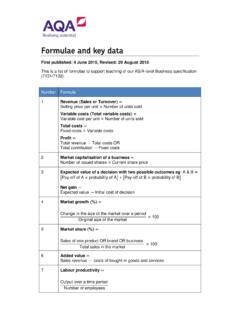
9 A fall in price leads to a bigger increase in quantity demanded; although the price of one unit is less the increase in sales means the total revenue earned is more if demand is price inelastic this means it is insensitive to price changes. In this case a price increase will increase revenue; this is because the fall in quantity demanded is smaller than the change in price if managers know the price elasticity they know what to do with price to increase revenue it provides useful information on the quantity demanded if price changes. This is important for deciding staffing, inventory controls and for planning cashflow and estimating profit and : what happens to profits (rather than revenue) will depend on the effect of a change in the quantity demanded and produced on costs not just whether revenue increases. An increase in revenue does not guarantee an increase in of using the price elasticity of demandThe price elasticity of demand measures the effect on quantity demanded of a change in price, with all other factors held constant.
10 In reality, many other factors will be changing as well, such as the income, the weather, the prices of other products and the marketing activities of this and other businesses. It might, therefore, be difficult to measure the price elasticity of demand although it may be possible to have approximate estimates (perhaps based in what has happened when the price was changed in the past).18 Influences on the price elasticity of demandDemand is likely to be more price inelastic if: the product is heavily branded so customers are not especially sensitive to price changes there are few substitutes a relatively low proportion of income is spent on this product so customers are less sensitive to a price change someone else is paying so customers are less sensitive to a price change because it does not affect them directly in the short-term customers may not find it easy to find alternatives; over time they have longer to find alternatives and demand will be more price to consider A price inelastic demand does not mean that quantity demanded does not change at all when price changes, just that the change in quantity demanded is less than the change in price (in percentages).