Transcription of Templates for Reporting Performance Measures
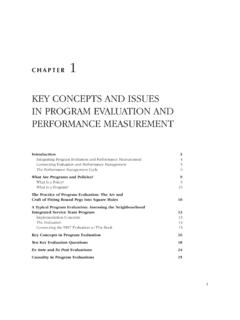
1 P1: OTA/XYZP2: ABCc05 JWBT214-ParmenterDecember 23, 200918:2 Printer Name: Yet to ComeCHAPTER5 Templates for ReportingPerformance MeasuresThe Reporting framework must accommodate the require-ments of different levels in the organization and the report-ing frequency that supports timely decision making. This chap-ter presents some better-practice formats that will help speedup this vital chapter should be read in conjunction with thewhitepapers and books written by Stephen Few, see Key Result Indicatorsin a Dashboard to the BoardA dashboard should be a one-page display, such as the exam-ples in Exhibits and The commentary should be includedon this good dashboard with the key result indicators (KRIs) go-ing in the right direction will give the board confidence thatmanagement knows what it is doing and that the ship is beingsteered in the right direction.
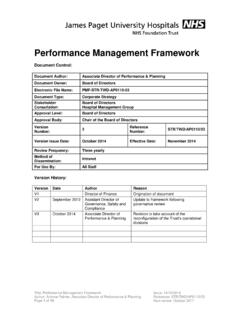
2 The board can then concentrateon what it does best: focusing on the horizon for icebergs inthe first-class lounge instead of parking themselves on the ship s155P1: OTA/XYZP2: ABCc05 JWBT214-ParmenterDecember 23, 200918:2 Printer Name: Yet to ComeKey Performance IndicatorsEXHIBIT Dashboard Examplebridge and getting in the way of the captain, who is trying toperform the important day-to-day duties. Ten examples of KRIboard dashboard graphs can be found in Exhibit SatisfactionCustomer satisfaction needs to be measured at least every threemonths by using statistical samples and focusing on your top10% to 20% of customers (the ones that are generating mostif not all of your bottom line).
3 This process does not need tobe overly expensive. If you think once a year is adequate forcustomer satisfaction, stick to running a sports club; you are notsafe in the public or private : OTA/XYZP2: ABCc05 JWBT214-ParmenterDecember 23, 200918:2 Printer Name: Yet to ComeEXHIBIT Dashboard Example157P1: OTA/XYZP2: ABCc05 JWBT214-ParmenterDecember 23, 200918:2 Printer Name: Yet to ComeKey Performance IndicatorsTop 10% of customers satisfaction0%20%40%60%80%100%Sep xxDec xxMar xxJun xxSep xxCustomers group ACustomers group BCustomers group CEXHIBIT for a Board DashboardEmployee SatisfactionThis is no different or less important than customer one person said, Happy staff make happy customers, whomake happy owners.
4 If you believe in this connection, run asurvey now! A staff satisfaction survey need not be expensiveand should never be done covering all staff; instead, it shouldbe replaced by a rolling survey with a vertical and horizontalslice of the management and satisfaction0%20%40%60%80%Mar xxJun xxSep xxDec xxMar xxDiv 1 Div 2 Div 3158P1: OTA/XYZP2: ABCc05 JWBT214-ParmenterDecember 23, 200918:2 Printer Name: Yet to ComeTemplates for Reporting Performance MeasuresValue of New BusinessAll businesses in the private sector need to focus on the growthof their rising-star products. It is important to monitor the pickupof this new business, especially among the top 10% to 20% ofcustomers, who create most of the bottom of new business $m02468 Aug xxSep xxOct xxNov xxDec xxJan xxFeb xxMar xxApr xxMay xxJun xxJul xxAug xxSep xxNew product 1 New product 2 New product 3 Net Profit before TaxSince the board will always have a focus on the year-end, it isworthwhile to show the cumulative net profit before tax (NPBT).
5 This graph will include the most recent forecast that should beupdated on a quarterly basis bottom-up. This is the only KRIgraph that starts at the beginning of the year; the rest shouldshow a rolling 15- to 18-month : OTA/XYZP2: ABCc05 JWBT214-ParmenterDecember 23, 200918:2 Printer Name: Yet to ComeKey Performance IndicatorsNPBT Year to date010,00020,00030,00040,000 Apr xxMay xxJun xxJul xxAug xxSep xxOct xxNov xxDec xxJan xxFeb xxMar xxYTD ActualBudgetYTD ForecastLast yearReturn on Capital EmployedReturn on capital employed (ROCE) is the old stalwart of re-porting. The difference now is that ROCE is no longer a keyperformance indicator (KPI) but a key result indicator (KRI).
6 This graph needs to be a 15- to 20-month trend on capital employed0%4%8%12%16%Aug xxSep xxOct xxNov xxDec xxJan xxFeb xxMar xxApr xxMay xxJun xxJul xxAug xxSep xxOct xxNov xxDec xxJan xxFeb xxMar xxActualTarget160P1: OTA/XYZP2: ABCc05 JWBT214-ParmenterDecember 23, 200918:2 Printer Name: Yet to ComeTemplates for Reporting Performance MeasuresCash FlowThe cash flow graph goes back at least 12 months and shouldbe projected out at least 6 months Flow 40 30 20 1001020 Aug xxSep xxOct xxNov xxDec xxJan xxFeb xxMar xxApr xxMay xxJun xxJul xxAug xxSep xxOct xxNov xxDec xxJan xxFeb xxMar xxOperatingInvestingFinancingExpenses as a Ratio to RevenueThe board should be interested in how effective the organizationhas been in utilizing technology and continuous improvementto ensure that cost of operations is tracking well against ratio0%15%30%45%60%Aug xxSep xxOct xxNov xxDec xxJan xxFeb xxMar xxApr xxMay xxJun xxJul xxAug
7 XxSep xxActualTarget161P1: OTA/XYZP2: ABCc05 JWBT214-ParmenterDecember 23, 200918:2 Printer Name: Yet to ComeKey Performance IndicatorsHealth and SafetyAll boards are interested in health and safety; the well-being ofstaff is a much higher priority these days than it was in the accidents05101520 Aug xxSep xxOct xxNov xxDec xxJan xxFeb xxMar xxApr xxMay xxJun xxJul xxAug xxSep xx050100150200 Div1 Div2 Rolling 12 monthsCapacityMonitoring the capacity of key machines and plant should goforward at least 5 to 12 months. The board needs to be awareof capacity limitations, and such a graph will help focus boardmembers on new capital expenditure / utilization0%20%40%60%80%100%Jan xxMar xxMay xxJul xxSep xxNov xxJan xxMar xxMainframeInternetxxxxx162P1: OTA/XYZP2: ABCc05 JWBT214-ParmenterDecember 23, 200918:2 Printer Name.
8 Yet to ComeTemplates for Reporting Performance MeasuresOperational EfficiencyOperational efficiency is a composite index based on a varietyof statistics, such as delivered in full on time, portion of idlemachine time (measuring key machines only), and the efficiency0%20%40%60%80%100%Apr xxMay xxJun xxJul xxAug xxSep xxOct xxNov xxDec xxJan xxFeb xxMar xxAug xxSep xxActualTargetReporting Performance Measures to ManagementMeasures must be reported to management in a timely mentioned throughout this book, key Performance indicators(KPIs) need to be reported 24/7, daily, or at the outside weekly;other Performance Measures can be reported less frequently,such as monthly and ReportingThe main KPIs are reported 24/7 or daily.
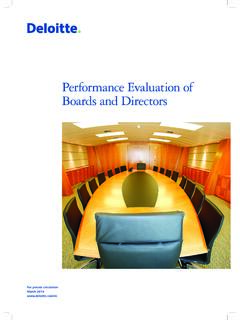
9 Exhibit showshow they should be reported on the intranet some form oftable giving the contact details, the problem, and some historyso a call can be made and the manager cannot hide poor : OTA/XYZP2: ABCc05 JWBT214-ParmenterDecember 23, 200918:2 Printer Name: Yet to ComeLate planes over 2 hoursTime:FlightnumberArrivallate byDeparturelate byTime addedRegion manager's nameCurrent time at locationWork MobileHomeLast 30 days30-dayave. oflast 3months30-dayave. oflast 6monthsBA12431:402:330:53 Pat Carruthers18:45xxxxx xxxxxxxxx434BA15981:452:300:45xxxxxxx19: 45xxxxx xxxxxxxxx234BA121:452:270:42xxxxxxx20:45 xxxxx xxxxxxxxx445BA1461:452:240:39xxxxxxx21:4 5xxxxx xxxxxxxxx544BA1771:452:210:36xxxxxxx22:4 5xxxxx xxxxxxxxx243BA2561:452:180:33xxxxxxx23:4 5xxxxx xxxxxxxxx545BA12491:452:150:30xxxxxxx0:4 5xxxxx xxxxxxxxx243 Total7 planesNo.
10 Of late planes over 1 hourContact detailsStatistics of last stopEXHIBIT KPI Exception Report Example164P1: OTA/XYZP2: ABCc05 JWBT214-ParmenterDecember 23, 200918:2 Printer Name: Yet to ComeTemplates for Reporting Performance MeasuresAnother benefit of providing senior management withdaily/weekly information on the key Performance areas is thatthe month-end becomes less important. In one company wherethere is a 9 o clock report every morning, management holdsa sweepstakes on the month-end result. Talking about themonthly numbers is a small part of the meeting, which hap-pens in the first week of the following month. In other words,if organizations report their KPIs on a 24/7 or daily basis, man-agement knows intuitively whether the organization is having agood or bad ReportingSome KPIs only need to be reported weekly.