Transcription of Tensile Properties of Aluminum using Lloyds Testing Machine
1 Experiment 1 Prepared by: Mukesh Bhardwaj Tensile Properties of Aluminum using Lloyds Testing Machine Nomenclature A Instantaneous area (m2) A0 Original area of cross-section at gauge length (m2) Af Area in the neck region after failure (m2) E Young s modulus of elasticity (Kg/m2, Pa) e Engineering strain e0 yield strain ef Strain at failure True strain 0 Strain hardening prior to test K Strength coefficient (Kg/m2, Pa) L Instantaneous gauge length (m) L0 Original gauge length, the portion of sample with minimum diameter (m) Lf Gauge length of the failed sample (m) n Strain hardening coefficient P Instantaneous load (Kg) Pmax Maximum load before failure of specimen (Kg) s Engineering stress (Kg/m2, Pa) s0 yield stress (Kg/m2, Pa) su Ultimate Tensile strength (Kg/m2, Pa) True stress (Kg/m2, Pa)
2 T time (s) UR Resilience (J/m3) UT Toughness (J/m3) Objective Characterization of cylindrical shaped Aluminum sample for Tensile Properties using engineering strain rate controlled Testing . Theory Engineering stress and engineering strain s = P/A0 e = (L-L0)/L0 = (A0 A)/A [Note: Constancy of volume A0L0 = AL] True stress and true strain )1()1(000000esLLLsLLsAAsAAAPAP )1ln()1ln(ln0000eLLLLLLdLLL Definitions and Properties within elastic limit Hooke s law: Within elastic limit, the deformation is proportional to load, , strain is proportional to stress . Young s modulus of elasticity, E: The ratio of stress to strain below elastic limit. Offset yield strength s0: stress corresponding to the intersection of the stress strain curve and a line parallel to the elastic part of the curve offset by strain s0 = P(strain offset = )/A0 Resilience: The maximum energy absorbed per unit volume within elastic limit UR = * s0e0 Definitions and Properties in plastic range Strain hardening: The relationship between stress and strain is nonlinear during plastic deformation.
3 Like E in elastic range, strength coefficient, K, strain hardening exponent, n and amount of strain hardening prior to test, 0 are used to characterize material in plastic range. = K ( + 0)n, log = log K + n log ( + 0) Ultimate Tensile strength: The maximum engineering stress before rupture of specimen. su = Pmax/A0 Toughness: Ability to absorb energy per unit volume in the plastic range. UT = * (s0 + su) * ef Experimental Procedure 1. Measure L0, A0. 2. Switch on lloyd Tensile Testing Machine and follow the instruction on its panel. 3. First set the Machine in manual mode and accept all other options as default values. 4. Carefully use double arrow button in upward and downward direction to adjust the position and fix the sample in grip. Precautions should be taken to avoid any hitting between grip and sample for load cell safety.
4 5. Double click icon GO on the computer. 6. Set Testing Machine under remote control mode through its panel. 7. On computer, select menu New test setup through arrow keys and press enter. 8. Leave all the options default except for the following Test type = TENSION Y axis = 10,000 Newtons X axis = 30 mm Speed = 5 10 mm/minute Limit = 30 mm 9. Press Esc. 10. Select menu Perform test . 11. Accept all the default options. 12. Empty graph will be displayed. 13. Follow the instructions in the menu given at the bottom. 14. First initialize load and strain to zero. 15. Start your experiment and observe the sample till it fails. 16. Note the graph displayed on the screen. 17. Select Cursor . Move it from left to right and note down all the coordinates. 18. Save your test results. 19.
5 Press Esc 20. On main menu, select Leave Machine control program 21. Switch off Testing Machine . 22. Remove sample from the grip 23. Measure Lf and Af of the failed sample and place it in the scrap container. Results Please use following tables format. Clearly show all the unit conversion factors for determining s, e, , using column 2 and column 3 values in table 2 separately outside table for one set of values. Please show calculations in table 3. Plot true and engineering stress strain curves in single graph. Also, plot log-log graph for determining K, n and 0. For determining 0, change its value starting from 0 such that you obtain straight line. For plotting, you may use computer. Table 1 L0 A0 d(L-L0)/dt *60,000 (Strain rate in mm/min) Lf Af Table 2 Serial # (L-L0)* 103 Load (Newtons) e s 1 2 3 4 5 6 7 8 9 Table 3 E s0 e0 su ef K n 0 UR UT Conclusions Analyze results and write unique observations.
6 Questions 1. Which Properties you think are sensitive to strain rate ? 2. Which Properties are engineered for a) Spring, b) Metal working, c) Machine component subjected to constant load ? 3. What is the root cause behind strain hardening ? 4. Although Young s modulus of elasticity for glass is more than steel, steel is preferred for designing engineering components. Why ? 5. Schematically compare hot working and cold working for relationship between stress and strain. Note: In report, no marks are allocated for information copied from this manual. You may directly use the symbols without defining them. All the units must be in SI. Experiment 2 Prepared by: Gadadhar Sahoo To Study Upper and Lower yield Points in Mild Steel using Universal Testing Machine Objective: Characterization of mechanical Properties of the mild steel and noting the upper and lower yield points in the flow curve.
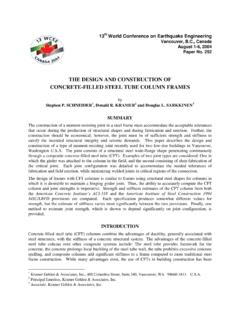
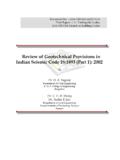
7 Requirements for the experiment a) Tensile specimen b) Universal Testing Machine (UTM) c) Computer aided software to be coupled with UTM d) Vernier caliper e) Punching stand, puncher and hammer Specimen geometry Tensile specimen had been machined of the dimension shown in figure-1 according to ASTM A-370 where gauge length to diameter ratio is 4 : 1. : Tensile specimen Gauge length (G) = 16mm, Distance between shoulders (B) = 28 mm, Length of reduced section (A) = 20 mm, Diameter of reduced section (D1) = 4 mm, Grip diameter (D2) = 8 mm, Radius of curvature (R) = 4 mm. Brief Description of the Equipment/ Machine Universal Testing Machine (UTS) used for this experiment is Hounsfield extensometer, model H 20 K-W of 20 kilo Newton capacity. The specimen is held at ends by means of grips with grip holder of the cross head.
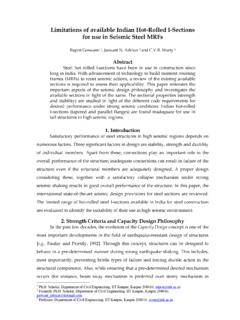
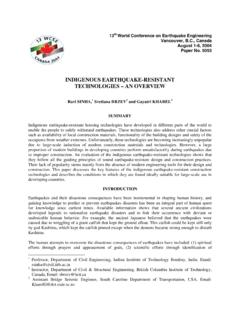
8 One end of the specimen is kept fixed while the other end is attached to a mobile cross-head. The cross head moves by means of an electric motor. The equipment has a provision for simultaneously measuring the applied load verses elongation. Important Parameters and Equations a) Original Gauge Length (Lo): Gauge length before application of force. b) Final Gauge Length (Lu): Gauge length after rupture, the two pieces having been carefully fitted back together so that their axes lie in a straight line. c) Engineering stress (s) and Engineering Strain (e) : s = P/A0, e = (Lu - L0)/L0 , d) True stress () and True Strain() : = s(1+e), () = ln(1+e) e) Tensile Strength or Ultimate Tensile Strength: stress corresponding to the maximum force Fig.
9 2 : Typical yield point behavior f) yield stress : When the metallic material exhibits a yield phenomenon, a point is reached during the test at which plastic deformation occurs without any increase in the force. yield strength : = FY/A0 , Where FY = Load at the yielding point; A0 : Initial area of the specimen For most ductile metals, yield strength is usually obtained from offset yield strength/proof stress method by drawing a parallel line with elastic region from strain in X-axis. Lower yield stress is taken to be yield strength when yield point elongation is observed. g) Upper yield stress : Value of stress at the moment when first decrease in force is observed (see Fig. 2 ). h) Lower yield stress Lowest value of stress during plastic yielding i) yield Point Elongation : The extension associated with discontinuous yield which occurs at approximately constant load following the onset of plastic flow.
10 It is associated with the propagation of Luder lines or bands (See Fig. 2) j) Percentage of Total Elongation at Fracture = (Lu Lo )/L0 k) Percentage Reduction of Area = ( So - SU )/S0 Maximum change in cross-sectional area which has occurred during the test ( So-SU) expressed as a percentage of the original cross-sectional area (So). Where Su is the final cross-sectional area. l) Strain hardening co-efficient (n): t = Ktn , Where t = true stress , t= true strain, n = strain hardening co-efficient Experimental procedure : a) If sample dimension is made by ASTM A 370 as reported above, then mark 16 mm gauge length by pen. b) Punch the specimen on the pen mark on punching stand by light hammering and finally measure gauge length by caliper within the mark. c) Measure original diameter atleast four times along the reduced section (gauge length) of the specimen.