Transcription of The Development of a Qualification Temperature Profile for ...
1 The Development of a Qualification Temperature Profile for Lead- free ReflowSolderingV. Kirchner, C. Klein, M. Beintner, I. Brauer, R. Holz and H. FeufelRobert Bosch GmbHSchwieberdingen/Reutlingen, GermanyAbstractA reflow soldering Profile has been developed for SnAgCu solder paste regarding mass production requirements,measurement and furnace tolerances as well as reliability requirements of automotive industry. The Profile is alimiting line between the Qualification of the semiconductor device and the assembly process to avoid harmfulstressing of the components. Measurements were performed on a test printed circuit board which was especiallydesigned for such investigations. Regarding non-hermetic solid state surface mount devices three Temperature classeshave been identified with peak temperatures of 245 C, 250 C and 260 C.
2 In addition to the peak Temperature , thenecessary time of the Temperature plateau 5K below the peak has been defined based on the achieve a reliable solder joint the conventionalreflow soldering process with SnPb solder paste isoften performed at minimum peak temperatures ofabout 203 C, i. e. at least 20 K above the liquidtemperature of SnPb (Tliquid=183 C). The lead-freesoldering process with SnAgCu solder paste(Tliquid=217 C) has to be performed at a minimumpeak Temperature of Tmin = 230 C just 13 K abovethe melting Temperature to minimize the heat impacton semiconductor and passive components and on theprinted circuit board. Despite the relatively lowtemperature, the reliability of the solder joint has tobe assured, for instance for safety relevantapplications in automotive industry.
3 To reach thistarget, the preheating time before solder peaktemperature and the time at Tmin have to be elongatedfor the lead- free process, i. e. minimum 20 s at230 the following, the Development of a temperatureprofile for SnAgCu reflow soldering will be presentedwhich considers the different aspects of serialproduction, reliability of solder joints and heat impacton the the basis of automotive electronic control units(ECU) with a moderate range of package sizes andvariety, a reflow Profile has been developed forSnAgCu solder paste with a melting point at aboutTliquid=217 C (1) . The SnAgCu solder paste is theworldwide accepted material for lead- free reflow andwave soldering in mass production (2). Theexperiments have been performed under massproduction conditions (850 mm/s = 33 inch/min)using the leading edge technology oven equipment,status 2003, i.
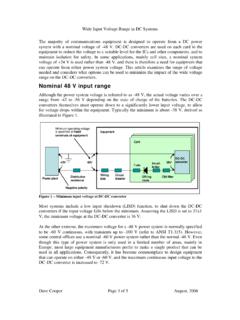
4 E. multiple heating zones, fullconvection, N2 described above the minimum peak Temperature of230 C has to be reached for at least 20 s, whichcorresponds to 1s at 233 C resulting from the peakshape (see Figure 1).Figure 1 - Curve shape for a peak Temperature ofat least 20 s at 230 C. The maximum temperatureof 233 C is reached for 1 sTest boardFor the experiment a special test printed circuit board(PCB) was designed. Polyimide resin with a glasstransition Temperature of Tg=260 C was used as basematerial for the PCB. The test board represents aprojection of the whole automotive ECU spectrum onone PCB. The largest Temperature difference ( T)between the coldest solder joint and the hottest pointexisting on this printed circuit assembly (PCA)spectrum is reflected on this test board ( T can beeven larger for other PCAs).
5 Apparently, the hottest200205210215220225230235240250 260 270 280 290 300 310 320 330 340 350t [ s ]T [ C ]20 sec @ 230 Ccoldest solder jointpoint on the PCA is the PCB itself. The coldest solderjoint defined by the largest thermal mass has toreach the 230 C for 20 s and is defined bythermographic measurements on serial boards andbased on profound soldering the tolerances during temperatureprofiling, different systematic failures have to beconsidered. First of all, there is the failure duringtemperature measurement itself. The measurement isperformed on top in the center of the packages with awell defined and repeatable preparation , the failure due to preparation has to befixed with K. In addition, the thermocouple(NiCrNi) together with the evaluation unit has anaccuracy of 1 K for pre-selected thermocouples (thestandard tolerance given by the manufacturer withoutselection is 1 K just for the thermocouple itself).
6 Altogether, the systematic failure due to temperaturemeasurement is:- Temperature measurement: tolerances for the furnace are given by the ovensuppliers as following:- furnace loading ( ): K- long term stability (5s-tolerance): 2 Schematics showing lower and uppertolerances of the Temperature window for theSnAgCu reflow solder Profile . The temperaturewindow is defined by the Temperature splitting Tof the devices. The lower tolerance of 3 K resultsout from the Gaussian error propagation forfurnace loading and long term stability as well astemperature measurement. In the upper toleranceof 5 K K (not indicated in the figure), thelongitudinal and transverse temperaturetolerances are includedThe lower tolerance of the Temperature window iscomposed out of furnace loading, long term stabilityand Temperature measurement.
7 Because these failuresare independent, the Gaussian error propagation canbe applied which results in a total lower tolerance K. As a consequence, the coldest solder joint hasto be profiled at 236 C, i. e. 3 K higher than withoutany on the test board design a longitudinal anda transverse Temperature Profile have to beconsidered. During the experiments it was found thatthe Temperature at the front and back end of the testPCA is always lower than in the middle, presumablydue to the flowing conditions around the PCA. Due tothe reflow furnace specification the transversaltemperature Profile is always thermal mass on the test board which representsthe coldest solder joint on the serial boards alreadyincludes both the upper tolerance of the Temperature windowthe transversal and longitudinal temperaturetolerances (2 K K) have to be added resulting ina total upper tolerance of 5 K the whole Temperature window, in additionto the measured T of the devices a total temperaturetolerance of 8 K K has to be considered (seeFigure 2).
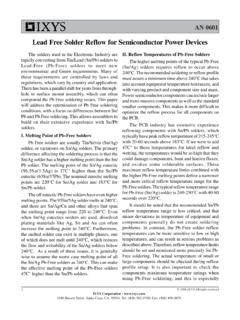
8 Peak form and widthIn order to obtain 230 C for 20 s at the coldest solderjoint and a peak Temperature Tpeak 260 C for thePCB and the smallest devices, e. g. SOT23, LQFP(14 x 14), LQFP (20 x 20), a hat type Profile isnecessary, as can be seen in Figure 3. This yields in40 s at Tmax 5 K = 255 C at the hottest devices andthe 3 A hat type Profile with 40 s at Tmax - 5K = 255 C for the small devices and the PCBresults from the requirement of 230 C for 20 s atthe coldest solder jointDevice classificationTo classify the non-hermetic solid state surface mountdevices into Temperature groups regarding the reflowpeak, the heat capacity and heat conductivity must beevaluated. For simplification, the advantage of thecomponent similarity with respect to the composition3 K20 s230 C236 C233 Csmalldeviceslargedevicesvery largedevices T devices215220225230235240245250255260265 250 260 270 280 290 300 310 320 330 340 350t [ s ]T [ C ]20 sec @ 230 C40 sec @ 255 CPCB coldest solder jointLQFP 20 x 20 LQFP 14 x 14(molded silicon) is taken into account and just thepackage volume and thickness are Figure 4, the measurements performed with thetestboard described above are shown.
9 Thetransportation speed was 850 mm/s (33 inch/min) andthe Temperature measurements were performed in thecenter on top of the packages. In total, thetemperature profiles for 19 different package typeswere measured on a multiple heating zone reflowoven with full convection, under N2 atmosphere. Forthe better overview just three representativemeasurements are depicted. Between the coldestsolder joint and the PCB itself, i. e. the hottest point, atemperature difference of 13 K was 4 Representative test boardmeasurements performed in the center on top ofthe packages. The transportation speed was850 mm/s (33 inch/min) in a full convectionmultiple heating zone reflow furnace under N2atmosphereIn addition to the measured peak temperatures , thetolerances have to be considered.
10 In Table 1, themeasured and corrected peak temperatures are the tolerances of the Temperature measurement,furnace loading and long term stability, transverseand longitudinal Temperature Profile are consideredresulting in Temperature differences between theactual measured and the corrected values of up K for the QFP144 (28 x 28).Obviously, the classification into three temperatureclasses results from the corrected values, i. e. 245 C,250 C and 255 C. Regarding these three classes themeasured T between the coldest solder joint and thedifferent packages are 4 K, 9 K and 14 K,respectively, whereas the corrected T are 10 K, K and 19 to volume and thickness of the devices, thethree classes can be split into nine subclasses depictedin Table on the fact that a lot of the small componentsare commonly qualified with a 260 C peaktemperature reflow Profile , the highest temperatureclass can be raised to 260 C, whereas the otherdevice classes stay at their temperatures .