Transcription of The Engagement Outliers - Health | Aon
1 Aon Hewitt Proprietary and Confidential Risk. reinsurance . Human Resources. The Engagement Outliers How to Achieve Big Improvements in Employee Engagement October 2013 Aon Hewitt Proprietary and Confidential The Engagement Outliers 2 What Is Required for a Successful Space Mission? A business unit executive of your average company has just received her annual employee Engagement survey results, and they are, Another just received his survey results and they re worse hovering around the bottom quartile of Engagement levels. Both leaders have something in common their CEOs have told them their organizations are expected to have top quartile employee Engagement levels within two years. The thoughts start racing: This is did Engagement get so low in the first place? What type of movement in Engagement is even possible? Where should we start? Figuring out how to get extraordinary employee Engagement and fast is the real challenge.
2 It s much like a space mission that requires strong leadership, planning, know-how, focused effort, steady a big a lot of fuel. Companies with average to low employee Engagement have a large percentage of employees who are disengaged for a variety of reasons, such as deteriorating perceptions about organizational reputation, leadership, communication and enabling processes. Average or low Engagement levels provide significant negative inertia and present long-term business risk. It s time to rebound in a big way but the fact is, large improvements in Engagement are uncommon. Despite this, some companies are able to achieve large gains in employee Engagement in a short period of time, and others that are already achieving top quartile employee Engagement levels are somehow still improving. These two types of organizations improve employee Engagement against the odds. These are the Engagement Outliers .
3 As the Engagement meters above describe, the average company in our global database has an employee population with about 6 out of 10 employees engaged. The bottom quartile companies find themselves with fewer than half of their employees engaged (46% or lower). Our data shows that companies in the top quartile (72% or higher) have higher growth and higher total shareholder return than other organizations. Knowing this important link to long-term performance, most leaders with average or below-average employee Engagement levels would like to quickly achieve top quartile Engagement scores. Starting with this end in mind, we analyzed almost 1,100 organizations in our global database that conducted repeat Engagement surveys between 2010 and 2012 to answer some specific questions: What is typical improvement in Engagement between survey cycles? How do you define really big improvement in Engagement what is the outlier boundary?
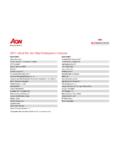
4 What are the Engagement Outliers doing to achieve such big improvements? How do some Engagement Outliers continue to improve upon top quartile scores? Aon Hewitt Proprietary and Confidential The Engagement Outliers 3 Escape Velocity Overcoming the Gravity of Disengagement When we took a look at what companies can expect in terms of Engagement , we saw a distribution of positive and negative changes to Engagement over the two-year period. A small percentage (6%) of companies experienced no change. However, we found that a majority of repeat clients in our sample (56%) increased Engagement . Our average client saw an improvement of 2 percentage points in Engagement in 2012. Looking only within clients that are improving, we found an average of 9 percentage point increases in Engagement . Finally, we found that the inner two quartiles experienced a +/-5% change in Engagement scores. To help answer the question, What does big improvement in employee Engagement look like?
5 We set the outlier threshold at one standard deviation above the average change in Engagement . With our average client seeing Engagement improvements of 2 percentage points, and one standard deviation of Engagement change as 12 percentage points, the outlier threshold equated to 14 percentage points in Engagement improvement. It should be noted that most companies in our sample conducted annual surveys (76%), while others conducted bi-annual surveys (24%). And it is important to note that a significantly higher number of the top quartile Engagement companies ( , those with 72% Engagement scores or higher) administer a survey annually (83%). This might suggest that an essential aspect of improving and sustaining high levels of employee Engagement is a commitment to regular Engagement surveying. Organizations Experiencing Engagement Change Between Survey Cycles 11% 8% 19% 26% 19% 11% 0%5%10%15%20%25%30%Decreasegreater than10% (1SD)Decrease5% to 10%Decrease1% to 5%Increase1% to 5%Increase5% to 14%Increasegreater than14% (1SD)+2% pts Average change in Engagement +/-5% pts Inner quartile change in Engagement +9% pts Average increase in Engagement for improving organizations 14%+ pts Outlier Engagement improvement Aon Hewitt Proprietary and Confidential The Engagement Outliers 4 Case Study: Global Information Services Company Below average Engagement at 48% Clear Objectives: Improve Engagement , reduce turnover and redefine the employee brand.
6 Focused Approach: One census survey and one pulse survey annually identifying Engagement and top driver priorities. Disciplined Actions: Diligent and overt focus on key Engagement drivers identified. Any employee walking the halls could tell you the five senior leader-directed priorities: Career Opportunities Intranet site modeled after LinkedIn for employees to post skills and interests and learn about opportunities Change Management Reinforced need to embrace change with company-branded change campaign Communication Social media and YouTube-modeled intranet to enhance bottom-up and top-down channels Empowering Performance Focused on individual empowerment of employees rather than letting them passively be led Local-level manager effectiveness and recognition 15 percentage point improvement in employee Engagement in two years The average surveying company has 6 out of 10 employees who are engaged (or 4 out 10 disengaged) and is experiencing a 2 percentage point improvement between survey cycles.
7 At this rate, it will take the average company more than six years to achieve top quartile Engagement levels 13 years for bottom quartile companies to move to the top quartile. To help understand how companies can accelerate employee Engagement improvements, we focused on the small group of outlier companies that are improving in significant ways to help understand a formula for success. The Engagement Outliers An Engagement Outlier is an organization that is able to achieve a large improvement in Engagement , or one that already had high Engagement levels and is still improving. But what exactly are these companies doing? To answer this integral question, we dug deeper into Engagement driver improvements for these two types of Engagement Outliers Most Improved Players and Best Getting Better. Most Improved Players Most Improved Players are companies that started out in the bottom quartile of Engagement , with 46% or less of their employees engaged, and were able to improve this score by 14 percentage points or more within two years or less.
8 Only about 25% of the bottom quartile (or 6% of companies overall) achieve these type of gains. Our data reveals that these organizations take significant actions to improve employee Engagement . Fix the basics. The first, most notable pattern we see is that Most Improved Players have addressed some basic work issues that are getting in the way of Engagement . Big improvements in low-scoring areas of safety and work environment top the list. In addition, we see large gains in enabling infrastructure processes, practices and resources that help people get work done. Get your culture out of the ditch. Second, we found that these turnaround companies also fixed some dismal employee experiences (40% or fewer positive perceptions) in cultural areas like leadership, people focus and reputation. It s next to impossible to engage large numbers of employees with a negative or dysfunctional culture. Said differently, imagine a highly engaged employee who also has negative perceptions of her company leadership, the quality of communication, the reputation of the company and negative perceptions about business-critical areas like innovation and customer focus.
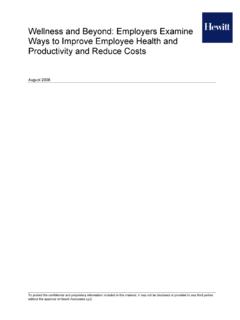
9 This employee is very difficult to imagine because those two qualities aren t compatible. Aon Hewitt Proprietary and Confidential The Engagement Outliers 5 Focus on fulfilling work. Engaged employees have meaningful work experiences. These companies have driven improvements in critical aspects of employees daily work a sense of accomplishment and autonomy, positive interactions with managers and coworkers, and a sense of future possibilities through career and skill development. The Most Improved Players: 14%+ Improvement from Bottom Quartile Engagement We also see improvement in aspects of rewards like managing performance, recognition, pay and benefits. However, the improvements for these companies appear to be relative and do not result in exceptionally high scores ( , only about half of the workforce having positive perceptions about these areas of rewards and recognition). The priorities and positive outcomes for Most Improved Players appear to be in the three areas outlined above the basics, the culture and the work.
10 0%20%40%60%80%100%BenefitsPayBrand AlignmentRecognitionManaging PerformanceSense of AccomplishmentAutonomy/ChoiceLearning and DevelopmentCareer OpportunitiesWork TasksCoworkersManagerCustomer FocusOrganization ReputationDiversityCommunicationValuing People/People FocusSenior LeadershipInnovationPeople/HR PracticesWork ProcessesResourcesWork/Life BalancePhysical Work EnvironmentSafetyLatest 2012 Previous 2010/11 Basics Culture Work Rewards Aon Hewitt Proprietary and Confidential The Engagement Outliers 6 Best Getting Better Another group of outlier companies that we see already have top quartile Engagement levels (72%+) and are still pulling away from the pack with incremental improvements. This is a remarkable feat given that most companies in the top quartile see decreases in Engagement rather than increases. Best Getting Better companies are rare (about 10% of all organizations), and are marked by strong perceptions in several key Engagement drivers, as well as continuous improvement in others.