Transcription of THE HEALTH SECTOR IN GHANA FACTS AND …
1 THE HEALTH SECTOR IN GHANA FACTS AND figures 2013 i FOREWORD Evidence based decision making is becoming very important in the HEALTH SECTOR . The development of the FACTS and figures 2013 is to provide a ready access to useful information on HEALTH for all the stakeholders in HEALTH . This report was compiled and put together by the Centre for HEALTH Information Mangement (CHIM). The Centre for HEALTH Information Management (CHIM) unit of the Policy, Planning, Monitoring and Evaluation Division (PPMED) of the GHANA HEALTH Service carries the responsibility for the collection, analysis, reporting and presentation of HEALTH service information in the HEALTH SECTOR . The data provided in this document are mainly summaries of service utilization data and population-based indicators. Readers are directed to The GHANA HEALTH Service Annual Report and the Ministry of HEALTH Holistic Assessment Report for detailed presentation of the performance of the HEALTH SECTOR .
2 The GHANA HEALTH Service aims to demonstrate the results achieved through the various HEALTH interventions to all the relevant stakeholders in HEALTH . We acknowledge the use of data from other agencies, which has been duly acknowledged in the document. Dr. Ebenezer Appiah-Denkyira DIRECTOR GENERAL GHANA HEALTH SERVICE ii TABLE OF CONTENTS TABLE OF CONTENTS .. ii List of Acronyms .. iii Demography and Vital Statistics .. 1 Population Distribution by Region 2013 .. 1 Population Distribution by District, Ashanti Region 2013 .. 1 Population Distribution by District, Brong Ahafo Region 2013 .. 2 Population Distribution by District, Central Region 2013 .. 3 Population Distribution by District, Eastern Region 2013 .. 3 Population Distribution by District, Greater Accra 2013 .. 4 Population Distribution by District, Northern Region 2013 .
3 5 Population Distribution by District, Upper East Region 2013 .. 6 Population Distribution by District, Upper West Region 2013 .. 6 Population Distribution by District, Volta Region 2013 .. 7 Population Distribution by District, Western Region 2013 .. 7 Vital Statistics .. 8 HEALTH Status Indicators .. 8 Total Fertility Rate by Region .. 8 Percentage of Population with no Education .. 9 Infant and Under Five Mortality Rate .. 10 Demographic and Socioeconomic Indicators .. 11 HEALTH -Related Millennium Development Goals .. 12 HEALTH Expenditure Indicators .. 13 HEALTH Infrastructure .. 14 HEALTH Facilities by Type and Ownership, 2012 .. 14 Number of Hospital Beds by Region and Ownership - 2012 .. 15 Distribution of HEALTH Professionals by Region 2012 .. 16 Doctor to Population Ratio .. 18 Nurse to Population Ratio.
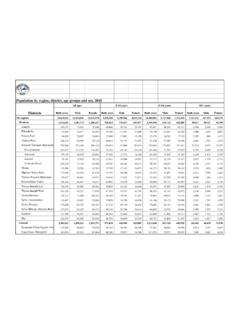
4 19 Hospital Bed Utilisation Statistics .. 20 HEALTH Service Outputs .. 21 Number of Outpatient Attendance by Region .. 21 Outpatient Attendance per Capita .. 22 Number of Inpatient Admissions by Region .. 23 Hospital Admission Rate .. 24 Case Fatality Rate for Malaria .. 24 Top Twenty Causes of Outpatient Morbidity 2009-2012 .. 25 PUBLIC HEALTH SERVICES .. 27 HIV Prevalence among pregnant women attending ANC clinics .. 27 HIV Prevalence among pregnant women by Age Groups .. 27 Guinea Worm Cases .. 27 Tuberculosis Case Detection per 100,000 Population .. 28 Tuberculosis Cure Rate .. 28 Tuberculosis Success Rate .. 29 Expanded Programme On Immunization .. 30 Reproductive HEALTH Services .. 35 APPENDIX 1 .. 38 APPENDIX 2 .. 40 iii List of Acronyms BMC Budget Management Centre CFR Case Fatality Rate CHAG Christian HEALTH Association of GHANA CHIM Centre for HEALTH Information Management CHPS Community HEALTH Planning and Services EPI Expanded Programme on Immunization GDHS GHANA Demographic and HEALTH Survey GHS GHANA HEALTH Service GSS GHANA Statistical Services HRD Human Resource Division NACP National AIDS Control Programme NHIS National HEALTH Insurance Scheme PHD Public HEALTH Division PMR Proportional Mortality Rate PPME Policy Planning Monitoring and Evaluation 1 Demography and Vital Statistics Population Distribution by Region 2013 NATIONAL TARGET POPULATION BY REGION - 2013 Region Regional Projection Target Population less than 1 year and expected pregnancy (4%) Target Population for WIFA (24%)
5 1 Ashanti 5,042,005 201,680 1,210,081 2 Brong Ahafo 2,418,511 96,740 580,443 3 Central 2,340,494 93,620 561,719 4 Eastern 2,744,908 109,796 658,778 5 Greater Accra 4,262,531 170,501 1,023,007 6 Northern 2,625,355 105,014 630,085 7 Upper East 1,071,813 42,873 257,235 8 Upper West 729,044 29,162 174,970 9 Volta 2,225,489 89,020 534,117 10 Western 2,472,012 98,880 593,283 National 25,932,162 1,037,286 6,223,718 Source: GSS 2000 Census (Projection) Population Distribution by District, Ashanti Region 2013 ASHANTI REGION TARGET POPULATION BY DISTRICT - 2013 District District Projection Target Population less than 1 year and expected pregnancy (4%) Target Population for WIFA (24%) 1 Adansi North 112,952 4,518 27,108 2 Adansi South 121,693 4,868 29,206 3 Afigya-Kwabre 143,591 5,744 34,462 4 Ahafo-Ano North 99,445 3,978 23,867 5 Ahafo-Ano South 128,317 5,133 30,796 6 Amansie Central 95,707 3,828 22,970 7 Amansie West 141,683 5,667 34,004 8 Asante-Akim Central 75,422 3,017 18,101 9 Asante-Akim North 72,972 2,919 17,513 10 Asante-Akim South 123,662 4,946 29,679 11 Asante-Mampong 92,870 3,715 22,289 12 Asokore-Mampong 321,497 12,860 77,159 13 Atwima-Kwanwoma 95,594 3,824 22,943 14 Atwima-Mponua 125,703 5,028 30,169 15 Atwima-Nwabiagya 157,181 6,287 37,723 16 Bekwai 124,483 4,979 29,876 2 17 Bosome-Freho 63,702 2,548 15,289 18 Bosomtwi 99,050 3,962 23,772 19 Ejisu-Juaben 151,630 6,065 36,391 20 Ejura-Sekyedumase 90,122 3,605 21,629 21 Kumasi 1824,944 72,998 437,987 22 Kwabre East 121,880 4,875 29,251 23 Obuasi 177,871 7,115 42.
6 689 24 Offinso North 59,994 2,400 14,399 25 Offinso 81,103 3,244 19,465 26 Sekyere Central 75,130 3,005 18,031 27 Sekyere East 65,575 2,623 15,738 28 Sekyere South 99,154 3,966 23,797 29 Sekyere-Afram Plains 30,097 1,204 7,223 30 Sekyere-Kumawu 68,981 2,759 16,556 Total 5,042,005 201,680 1,210,081 Source: GSS 2000 Census (Projection) Population Distribution by District, Brong Ahafo Region 2013 BRONG AHAFO REGION TARGET POPULATION BY DISTRICT - 2013 District District Projection Target Population less than 1 year and expected pregnancy (4%) Target Population for WIFA (24%) 1 Asunafo North 130,486 5,219 31,317 2 Asunafo South 100,027 4,001 24,007 3 Asutifi North 55,465 2,219 13,312 4 Asutifi South 55,303 2,212 13,273 5 Atebubu-Amanten 110,867 4,435 26,608 6 Banda 21,226 849 5,094 7 Berekum 135,659 5,426 32,558 8 Dormaa East 53,238 2,130 12,777 9 Dormaa West 49,896 1,996 11,975 10 Dormaa 117,327 4,693 28,159 11 Jaman North 86,924 3,477 20,862 12 Jaman South 96,960 3,878 23,270 13 Kintampo North 99,923 3,997 23,981 14 Kintampo South 84,769 3,391 20,345 15 Nkoranza North 68,961 2,758 16,551 16 Nkoranza South 105,625 4,225 25,350 17 Pru 135,262 5,410 32,463 18 Sene East 63,327 2,533 15,198 19 Sene West 61,012 2,440 14,643 20 Sunyani West 89,240 3,570 21,418 21 Sunyani 128,957 5,158 30,950 22 Tain 92,203 3,688 22,129 3 23 Tano North 83,694 3,348 20,087 24 Tano South 81,764 3,271 19,623 25 Techiman North 61,816 2,473 14.
7 836 26 Techiman 154,664 6,187 37,119 27 Wenchi 93,914 3,757 22,539 Total 2,418,511 96,740 580,443 Source: GSS 2000 Census (Projection) Population Distribution by District, Central Region 2013 CENTRAL REGION TARGET POPULATION BY DISTRICT 2013 District District Projection Target Population less than 1 year and expected pregnancy (4%) Target Population for WIFA (24%) 1 Abura-Asebu-Kwamankese 124,563 4,983 29,895 2 Agona East 91,330 3,653 21,919 3 Agona West 122,621 4,905 29,429 4 Ajumako-Enyan-Essiam 146,738 5,870 35,217 5 Asikuma-Odoben-Brakwa 119,802 4,792 28,752 6 Assin North 171,499 6,860 41,160 7 Assin South 110,807 4,432 26,594 8 Awutu Senya East 114,343 4,574 27,442 9 Awutu Senya 93,260 3,730 22,382 10 Cape Coast 180,591 7,224 43,342 11 Efutu 72,916 2,917 17,500 12 Ekumfi 55,520 2,221 13,325 13 Gomoa East 220,108 8,804 52,826 14 Gomoa West 143,701 5,748 34,488 15 Komenda-Edna-Eguafo-Abirem 153,816 6,153 36,916 16 Mfantsiman 153,419 6,137 36,821 17 Twifo-Ati-Mokwa 65,630 2,625 15,751 18 Twifo-Hemang Lower Denkyira 58,602 2,344 14,065 19 Upper Denkyira East 77,394 3,096 18,575 20 Upper Denkyira West 63,835 2,553 15,320 Total 2,340,494 93,620 561,719 Source.
8 GSS 2000 Census (Projection) Population Distribution by District, Eastern Region 2013 EASTERN REGION TARGET POPULATION BY DISTRICT 2013 District District Projection Target Population less than 1 year and expected pregnancy (4%) Target Population for WIFA (24%) 4 1 Afram Plains South 120,570 4,823 28,937 2 Akwapim North 142,275 5,691 34,146 3 Akwapim South 39,093 1,564 9,382 4 Akyemansa 101,507 4,060 24,362 5 Asuogyaman 102,207 4,088 24,530 6 Atiwa 115,317 4,613 27,676 7 Ayensuano 79,462 3,178 19,071 8 Birim Central 151,017 6,041 36,244 9 Birim North 82,256 3,290 19,741 10 Birim South 124,850 4,994 29,964 11 Denkyembour 81,818 3,273 19,636 12 East Akim 175,022 7,001 42,005 13 Fanteakwa 113,224 4,529 27,174 14 Kwaebibirem 118,916 4,757 28,540 15 Kwahu East 80,398 3,216 19,296 16 Kwahu North 106,927 4,277 25,663 17 Kwahu South 72,718 2,909 17,452 18 Kwahu West 97,556 3,902 23,413 19 Lower-Manya Krobo 93,034 3,721 22,328 20 New Juaben 191,525 7,661 45,966 21 Nsawam-Adoagyiri 89,650 3,586 21,516 22 Suhum 95,200 3,808 22,848 23 Upper Manya-Krobo 75,152 3,006 18,036 24 Upper West Akim 90,746 3,630 21.
9 779 25 West Akim 112,894 4,516 27,095 26 Yilo-Krobo 91,575 3,663 21,978 Total 2,744,908 109,796 658,778 Source: GSS 2000 Census (Projection) Population Distribution by District, Greater Accra 2013 GREATER ACCRA TARGET POPULATION BY DISTRICT - 2013 District District Projection Target Population less than 1 year and expected pregnancy (4%) Target Population for WIFA (24%) 1 Accra Metro 1,769,921 70,797 424,781 2 Ada East 76,183 3,047 18,284 3 Ada West 62,847 2,514 15,083 4 Adentan 83,139 3,326 19,953 5 Ashaiman 202,996 8,120 48,719 6 Ga Central 45,658 1,826 10,958 7 Ga East 157,044 6,282 37,691 8 Ga South 516,220 20,649 123,893 9 Ga West 233,626 9,345 56,070 10 Kpone-Katamanso 116,781 4,671 28,027 5 11 La-Dade-Kotopon 195,083 7,803 46,820 12 La-Nkwantanang-Madina 118,973 4,759 28,554 13 Ledzokuku-Krowor 242,283 9,691 58,148 14 Ningo Prampram 75,172 3,007 18,041 15 Shai-Osudoku 55,398 2,216 13,296 16 Tema 311,206 12,448 74,690 Total 4,262,531 170,501 1,023,007 Source.
10 GSS 2000 Census (Projection) Population Distribution by District, Northern Region 2013 NORTHERN REGION TARGET POPULATION BY DISTRICT - 2013 District District Projection Target Population less than 1 year and expected pregnancy (4%) Target Population for WIFA (24%) 1 Bole 65,217 2,609 15,652 2 Bunkpurugu-Yunyoo 129,804 5,192 31,153 3 Central Gonja 93,048 3,722 22,331 4 Chereponi 56,536 2,261 13,569 5 East Gonja 143,420 5,737 34,421 6 East Mamprusi 128,129 5,125 30,751 7 Gushiegu 117,806 4,712 28,273 8 Karaga 82,278 3,291 19,747 9 Kpandai 115,219 4,609 27,653 10 Kumbungu 41,182 1,647 9,884 11 Mamprugu-Moagduri 49,653 1,986 11,917 12 Mion 86,118 3,445 20,668 13 Nanumba North 149,915 5,997 35,980 14 Nanumba South 98,964 3,959 23,751 15 North Gonja 46,109 1,844 11,066 16 Saboba 69,572 2,783 16,697 17 Sagnarigu 156,813 6,273 37,635 18 Savelugu-Nanton 147,479 5,899 35,395 19 Sawla-Tuna-Kalba 105,739 4,230 25,377 20 Tamale 236,388 9,456 56,733 21 Tatale-Sangule 62,868 2,515 15,088 22 Tolon 77,759 3,110 18,662 23 West Gonja 43,603 1,744 10,465 24 West Mamprusi 128,244 5,130 30,778 25 Yendi 125,219 5,009 30.