Transcription of The Logit Model: Estimation, Testing and Interpretation
1 The Logit Model: estimation , Testing and InterpretationHerman J. BierensOctober 25, 20081 Introduction to maximum likelihood The likelihood functionConsider a random sampleY1, .., Ynfrom the Bernoulli distribution:Pr[Yj=1]=p0Pr[Yj=0]=1 p0,wherep0is unknown. For example, tossntimes a coin for which you suspectthat it is unfair:p06= ,and for each tossingjassignYj=1if the outcomeis heads andYj=0if the outcome is tails. The question is how to estimatep0and how to test the null hypothesis that the coin is fair:p0= probability function involved can be written asf(y|p0)=Pr[Yj=y]=py0(1 p0)1 y=(p0ify=1,1 p0ify= , lety1, .., ynbe a given sequence of zeros and ones. Thus, eachyjis ei-ther0or1. The joint probability function of the random sampleY1,Y2.)
2 , Ynis defined asfn(y1, .., yn|p0)=Pr[Y1=y1andY2= andYn=yn].1 Because the random variablesY1,Y2, .., Ynare independent, we can writePr[Y1=y1andY2= andYn=yn]=Pr[Y1=y1] Pr[Y2=y2] .. Pr[Yn=yn]=f(y1|p0) f(y2|p0) .. f(yn|p0)=nYj=1f(yj|p0),hencefn(y1, .., yn|p0)=nYj=1pyj0(1 p0)1 yj= nYj=1pyj0 nYj=1(1 p0)1 yj =pPnj=1yj0(1 p0)n Pnj= the given non-random sequencey1, .., ynby the random sampleY1,Y2, .., Ynand the unknown probabilityp0by a variablepin the interval(0,1)yields the likelihood functionLn(p)=fn(Y1, .., Yn|p)=pPnj=1Yj(1 p)n Pnj=1 YjFor the casep=p0the likelihood function can be interpreted as the jointprobability that we draw a particular sampleY1, .., Maximum likelihood estimationThe idea of maximum likelihood (ML) estimation is now to choosepsuchthatLn(p)is maximal.
3 In other words, choosepsuch that the probability ofdrawing this particular sampleY1, .., Ynis that maximizingLn(p)is equivalent to maximizingln (Ln(p)), ,ln (Ln(p)) = nXj=1Yj ln(p)+ n nXj=1Yj ln(1 p)=n Yln(p)+(1 Y)ln(1 p) ,2whereY=1nnXj=1 Yjisthesamplemean. Therefore,theMLestimatorbpin this case can beobtained from thefirst-order condition for a maximum ofln (Ln(p))inp=bp:0=dln (Ln(bp))dbp=n Ydln(bp)dbp+(1 Y)dln(1 bp)dbp!=n Ydln(bp)dbp+(1 Y)dln(1 bp)d(1 bp) d(1 bp)dbp!=n Y1bp+(1 Y)11 bp ( 1)!=n Ybp 1 Y1 bp!=n Y(1 bp) bp 1 Y bp(1 bp) =n Y bpbp(1 bp)!wherewehaveusedthefactthatdln(x)/dx= 1 , in this case theML estimatorbpofp0isthesamplemean:bp= that this is an unbiased estimator:E(bp)=1nPnj=1E(Yj)= Large sample statistical inferenceIt can be shown (but this requires advanced probability theory) that if thesample sizenis large then n(bp p0)is approximately normally distributed, , n(bp p0)=1 nnXj=1(Yj p0) N[0, 20],where 20=var(Yj)=Eh(Yj p0)2i=(1 p0)2p0+( p0)2(1 p0)=p0(1 p0).
4 3 Thus, for large sample sizen, n(bp p0)qp0(1 p0) N[0,1].(1)This result can be used to test hypotheses particular, underthe null hypothesis that the coin is fair,p0= ,wehave2 n(bp ) = n(bp ) N[0,1],Therefore,2 n(bp )can be used as the test statistic of the standardnormal test of the null hypothesisp0=1/2,as follows. Recall that for astandard normal random variableU,Pr [|U|> ] = , under thenull hypothesisp0=1/2one would expect thatPrh 2 n(bp ) > 2 n(bp ) |2 n(bp )|> we reject the null hypothesisp0=1/2atthe 5% significance level, because this is not what one would expect if thenull hypothesis is true, and if|2 n(bp )| we accept thisnull hypothesis, as this result is then in accordance with the null hypothesisp0=1 result (1) can also be used to endow the unknown probabilityp0withaconfidence interval, for example the 95% confidence interval, as follows.
5 Theresult (1) impliesPr n(bp p0)qp0(1 p0) = ,which, after some straightforward calculations, can be shown to be equivalenttoPrhpn p0 pni= +( )2/2 (1 bp)+( )2/4n+( )2pn= +( )2/2+ (1 bp)+( )2/4n+( )24 The intervalhpn,pniis now the 95% confidence interval An application election pollsConsider a presidential election with two candidates, candidateAand can-didateB,and letp0be the fraction of likely voters who favor candidateA,just before the election is held. To predict the outcome of the election, apolling agency draws a random sample of sizen= 3000,for example, fromthe population of likely that1800of the respondents ex-press a preference for candidateA. Thus, the fraction of respondents favoringcandidateAisbp= 3000andbp= the formulasforpnandpnyieldspn= ,pn= , the 95% confidence interval of100 p0is[58,62].
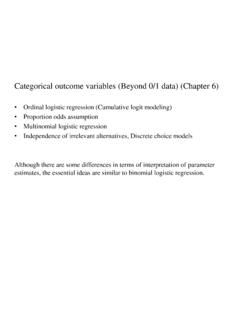
6 The polling resultsare therefore stated as: 60% of the likely voters will vote for candidateA,with a margin of error of Motivation for maximum likelihood esti-mationA more formal motivation for ML estimation is based on the fact that for0<x<1andx>1,ln(x)<x is illustrated in the following picture:1 How to draw such a sample is beyond the scope of this lecture (x) x inequalityln(x)<x 1is strict forx6=1,andln(1) = , takingx=f(Yj|p)/f(Yj|p0),we have the inequalityln f(Yj|p)f(Yj|p0)! f(Yj|p)f(Yj|p0) expectations, it follows thatE"ln f(Yj|p)f(Yj|p0)!# E"f(Yj|p)f(Yj|p0)# 1=f(1|p)f(1|p0)Pr[Yj=1]+f(0|p)f(0|p0)Pr[ Yj=0] 1=pp0p0+1 p1 p0(1 p0) 1=p+1 p 1=0,(2)henceE[ln (f(Yj|p))] E[ln (f(Yj|p0))] =E"ln f(Yj|p)f(Yj|p0)!# 0,and therefore,E[ln (Ln(p))] E[ln (Ln(p0))].
7 (3)Thus,E[ln (Ln(p))]is maximal forp=p0,anditcanbeshownthatthismaximum is Maximum likelihood estimation of the The Logit model with one explanatory variableNext, let(Y1,X1), ..,(Yn,Xn)be a random sample from the conditional Logitdistribution:Pr[Yj=1|Xj]=11+exp( 0 0Xj),(4)Pr[Yj=0|Xj]=1 Pr[Yj=1|Xj]=exp ( 0 0Xj)1+exp( 0 0Xj)where theXj s are the explanatory variables and 0and 0are unknownparameters to be estimated. This model is called a Logit model , becausePr[Yj=1|Xj]=F( 0+ 0Xj)(5)whereF(x)=11+exp( x)(6)is the distribution function of the logistic ( Logit ) conditional probability function involved isf(y|Xj, 0, 0)=Pr[Yj=y|Xj]=F( 0+ 0Xj)y(1 F( 0+ 0Xj))1 y=(F( 0+ 0Xj)ify=1,1 F( 0+ 0Xj)ify= the conditional log-likelihood function isln (Ln( , )) =nXj=1ln (f(Yj|Xj, , ))=nXj=1 Yjln (F( + Xj)) +nXj=1(1 Yj)ln(1 F( + Xj))= nXj=1(1 Yj)( + Xj) nXj=1ln (1 + exp ( Xj)).)
8 (7)7 Similar to (3) we haveE[ln(Ln( , ))|X1, .., Xn] E[ln(Ln( 0, 0))|X1, .., Xn].Again, this result motivates to estimate 0and 0by maximizingln (Ln( , ))to and :ln Ln(b ,b ) =max , ln (Ln( , )).However, there is no longer an explicit solution forb andb .These MLestimators have to be solved numerically. Your econometrics software will dothat for Pseudo t-valuesIt can be shown that if the sample sizenis large then n(b 0) N(0, 2 ), n b 0 N(0, 2 ).Given consistent estimatorsb 2 andb 2 of the unknown variances 2 and 2 ,respectively (which are computed by your econometrics software), we thenhave n(b 0)b N(0,1), n b 0 b N(0,1).These results can be used to test whether the coefficients 0and 0are zeroor not. In particular the null hypothesis 0=0is of interest, because thishypothesis implies that the conditional probabilityPr[Yj=1|Xj]does notdepend the null hypothesis 0=0we havebt = nb b N(0,1).
9 Recall that the 5% critical value of the two-sided standard normal test Thus, for example, the null hypothesis 0=0is rejected at the 5%significance level in favor of the alternative hypothesis 06=0if bt > ,andacceptedif bt statisticbt is called thepseudot-value ofb because it is used in thesame way as the t-value in linear regression, andb is called the standarderror ofb .Your econometric software will report the ML estimators togetherwith their corresponding pseudo t-values and/or standard The general Logit modelThe general Logit model takes the formPr[Yj=1|X1j,..Xk,j]=11+exp( 01X1j .. 0kXkj)(8)=11+exp Pki=1 0iXij ,where one of theXijequals 1 for the constant term, for example, letXkj=1,and the 0i s are the true parameter values.
10 This model can be estimated byML in the same way as before. Thus, the log-likelihood function isln (Ln( 1, .., k)) = nXj=1(1 Yj)kXi=1 iXij nXj=1ln 1+exp kXi=1 iXij!!,(9)and the ML estimatorsb 1, ..,b kare obtained by maximizingln (Ln( 1, .., k)):ln Ln(b 1,..,b k) =max 1,.., kln (Ln( 1, .., k)).Again, it can be shown that ifnis large then fori=1, .., k, n b i 0i N[0, 2i].Given consistent estimatorsb 2iof the variances 2i,it follows then that n b i 0i b i N[0,1]fori=1, .., econometrics software will report the ML estimatorsb itogether with their corresponding pseudo t-valuesbti= nb i/b iand/orstandard errorsb Testing joint significanceNow suppose you want to test the joint null hypothesisH0: 01=0, 02=0, .., 0m=0,(10)9wherem< are two ways to do that.