Transcription of The Pressure - Enthalpy Chart
1 How often have you heard the statement it isn t cooling? Well it may seem a bit picky, but it is not entirely accurate tosay the refrigeration system cools . If the system is operatingproperly, the refrigerated space should be cooler than its sur-roundings, but it is the result of a heat transfer process. Heat istransferred from the refrigerated space to the refrigerant, andultimately from the r efrigerant to the ambient (at the condens-er). A lower temperature in the refrigerated space is thebyproduct of this heat transfer process. Perhaps this is a minorshift in thinking, but in viewing the refrigeration system forwhat it heat transfer more fundamentalapproach for diagnosis may be an effort to gain a better understanding of the various heattransfer processes o ccurring in a refrigeration system, the pres-sure- Enthalpy Chart can be of great use.
2 Additionally, onceunderstood, the Chart can be a tremendous benefit in analyz-ing the relative health of a refrigeration system. Let s followthe refrigerant on a quick journey through a refrigeration sys-tem to see what it experiences, and plot it on the Chart as wego. Before we start, a few technical definitions are in order:Refrigeration- The achievement of a temperature below thatof the immediate Heat of Fusion- The quantity of heat (Btu/lb) requiredto change 1 lb. of material from the solid phase into the liquidphase. Latent Heat of Vaporization- The quantity of heat (Btu/lb)required to change 1 lb. of material from the liquid phase intothe vapor Heat- Heat that i s absorbed/rejected by a material,resulting in a change of Heat- Heat that is absorbed/rejected by a materialresulting in a change of physical state (occurring at constanttemperature).
3 Saturation Temperature- That temperature at which a liquidstarts to boil (or vapor starts to condense). The saturation tem-perature (boiling temperature) is constant at a given Pressure ,*and increases as the Pressure increases. A liquid cannot beraised above its saturation temperature. Whenever the refriger-ant is present in two states (liquid and vapor) the refrigerantmixture will be at the saturation At a given Pressure , the difference between avapor s temperature and its saturation At a given Pressure , the difference between a liq-uid s temperature and its saturation of Refrigeration- The amount of cooling required tochange (freeze) 1 ton of water at 32 F into ice at 32 F, in a 24hour British Thermal Unit: The amount of heat required toraise 1 lb.
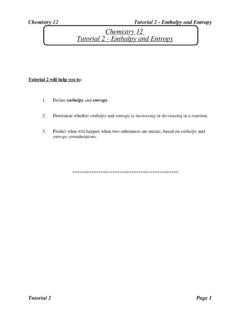
4 Of water 1 Ton- 12,000 Btu/hrFig. 1 illustrates some of these definitions, using water as themedium experiencing a heat transfer process. This graph plotsthe water temperature vs. the Enthalpy of the water (heat contentin Btu/lb). We all know that water boils at 212 F (atmosphericpressure at sea level). By definition, water at atmospheric pres-sure, at a temperature lower than 212 F, is subcooled. So, westart with subcooled water at 42 F, and begin transferring heat toit. Assuming we are working with 1 lb. of water, for every Btuadded, a corresponding temperature increase of 1 F will beachieved (the definition for one Btu). It we continue to add heat,eventually the water s temperature will increase to 212 F (thesaturation temperature at atmospheric Pressure ).
5 At this point,the water begins to change states from a liquid to a vapor (boil).As noted on the graph, the water will experience no further tem-perature a given Pressure , the saturation (boiling)temperature is the highest temperature a liquid can ever the amount of heat transferred to the water simplyincreases the rate at which the water boils. If the temperature ofthe vapor were to be measured, we d find it to be 212 F (saturat-ed vapor). Once the vapor has separated from the liquid, addi-tional heat transferred to it will result in a temperature definition, the vapor at 232 F (20 above the saturation tem-perature), is is interesting to note that while it takes only 1 Btu to raise 1lb. of water 1 F, it takes almost 1000 times that amount ( ) for the 1 lb.
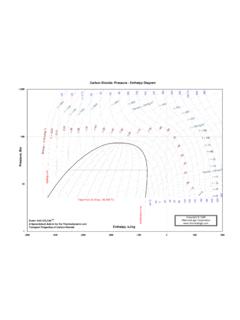
6 Mass of water to change states from liquid tovapor. A boiling liquid will always absorb more heat than avapor experiencing a temperature increase (per u nit of mass).Understanding this principle explains why the evaporator in arefrigeration system should always be nearly filled with liquidrefrigerant. Otherwise, its full potential as a heat transferdevice will not be Pressure - Enthalpy Chart , as shown in Fig. 2, displays allthe pertinent properties for a given refrigerant (in this exampleR22). The bubble to the left is the portion of t he diagram wherethe refrigerant is in the saturated condition. The blue line onthe left of the bubble represents the 100% saturated liquid line,the thin dashed line on the right represents the 100% saturatedvapor line, and anywhere inside the bubble represents therefrigerant as a mixture of saturated liquid and saturated the left of the saturated liquid line is the area where therefrigerant can exist at a temperature lower than the saturatedThe Pressure - Enthalpy ChartBy Dave Demma, Senior Application Engineer - Supermarket RefrigerationJanuary 2005 / FORM 5-200* Except for zeotrope refrigerantscondition; subcooled liquid.
7 To the right of the saturated vaporline is the area where the refrigerant can exist at a temperaturehigher than the saturated condition; superheated vapor. Thecritical point is the highest temperature that the refrigerant canexperience, and remain in the liquid form. If the temperatureexceeds the critical point, regardless of Pressure , the refriger-ant can only exist in t he vapor of the relevant properties are shown in Fig. 2: Pressure - The vertical axis of the Chart , in psia (see pink line).To obtain gauge Pressure , subtract atmospheric Pressure . Enthalpy - The horizontal axis of the Chart shows the heat con-tent of the refrigerant in Constant temperature lines generally run in a verti-cal direction in the superheated vapor & sub-cooled liquid portionof the Chart .
8 In the saturated bubble, the constant temperature lineis along the horizontal, illustrating that the saturation temperatureis constant at a given Pressure (see black line).Specific Volume- Constant volume lines extend from the redline saturated vapor line out into the superheated vapor-por-tion of the Chart at a slight angle from the horizontal axis. Specific volume is expressed in (see orange line).Entropy- Entropy is the mathematical relationship betweenheat and temperature, and relates to the availability of lines extend at an angle from the saturated vapor presence on the Chart is relevant in that vapor compres-sion (in the ideal cycle) occurs at constant entropy (see darkblue line).
9 Quality- Lines of constant quality appear vertically, and onlywithin the saturation bubble. The refrigerant within the bubbleis a mixture of liquid and vapor at saturation, and the quality isthe percentage of the mixture which is in the vapor state (seegreen line).The ultimate goal of the refrigeration system is to get therefrigerant into a condition where it can be useful as a mediumto transfer heat from the refrigerated space. If the systemdesign requires a -10 F space temperature, you would expectthe refrigerant temperature in the evaporator to be -20 F (a 10 temperature difference). This allowsthe relatively warmer air (something above the design of -10 F) to be blown across the evaporator, flowing relativelycooler refrigerant (-20 F).
10 The result is the transfer of heatfrom the warmer air to the cooler r 2 / FORM 5-200 Water at Atmospheric Pressure ( psia Pressure )RefrigerationBoiling at constant Pressure and temperatureSaturationTemperatureSuperhea tedVaporSubcooledLiquidLatent Heat of Btu per lb20 Superheat (232 212 = 20 ) Enthalpy (Btu per lb)Temperature ( F)6008001000120040020032212232 Fig. 1 Water undergoing a change of purpose of the compressor is to take a low Pressure vaporand compress it into a high Pressure vapor. This occurs(in theory) at a constant entropy. In an ideal cycle, the refriger-ant vapor would enter the compressor as a saturated Ideal CycleIf the operating temperatures and pressures are known, therefrigeration system can be plotted on the P-H diagram.