Transcription of The Roots of Gender Inequality in Developing Countries
1 The Roots of GenderInequality in DevelopingCountriesSeema JayachandranDepartment of Economics, Northwestern University, Evanston, Illinois 60208;email: Rev. Econ. 2015. 7:63 88 First published online as a Review in Advance onFebruary 20, 2015 TheAnnual Review of Economicsis online article s 2015 by Annual rights reservedJEL codes: J16, O10, O14, O15 Keywordsgender discrimination, economic development, cultural norms,son preferenceAbstractIs the high degree of Gender Inequality in Developing Countries ineducation, personal autonomy, and more explained by underdevel-opment itself? Or do the societies that are poor today hold certaincultural views that lead to Gender Inequality ? This article discussesseveral mechanisms through which Gender gaps narrow as countriesgrow.
2 I argue that although much of the GDP/ Gender -inequalityrelationship can be explained by the process of development, society-specific factors are also at play: Many Countries that are poor today havecultural norms that exacerbate favoritism toward males. Norms suchas patrilocality and concern for women s purity help explain themale-skewed sex ratio in India and China and low female employ-ment in India, the Middle East, and North Africa, for example. I alsodiscuss why the sex ratio has become more male-skewed with de-velopment. Finally, I lay out some policy approaches to address Rev. Econ. :63-88. Downloaded from Access provided by Northwestern University on 10/30/17. For personal use only. 1. INTRODUCTIONG ender gaps favoring males in education, health, personal autonomy, and more are sys-tematically larger in poor Countries than in rich Countries .
3 This article explores the root causesof Gender Inequality in poor Countries . Is the higher level of Gender Inequality explained byunderdevelopment itself? Or do the Countries that are poor today have certain characteristics andcultural beliefs that lead to the larger Gender gaps?I begin by documenting some basic facts about how Gender Inequality correlates with the levelof economic development. I then discuss several mechanisms through which the process of eco-nomicdevelopment theoretically couldimprove the relative outcomesofwomen andreview recentevidence on these argue that although much of the relationship between development and Gender Inequality canbe explained by the process of development, society-specific factors are also at play.
4 Manycountries that are poor today have cultural features that exacerbate favoritism toward poor is insufficient to explain parents strong desire to have a son in China and India, then discuss in greater detail the problem of the male-skewed sex ratio at birth, which differsfrom most other manifestations of Gender bias in that it has been intensifying, not lessening, witheconomic development. Finally, I lay out some policy approaches to accelerate the narrowing ofgender that the article s focus is the causes rather than effects of Gender Inequality , and thus I donotreview the literature on thereverse direction ofcausality, that is,how Gender Inequality hinderseconomic , much of the discussion hints at inefficiencies that resultfrom constricted opportunities for women and MORE Gender Inequality IN POOR Countries : SOME FACTSP oorcountries by nomeans haveamonopoly ongender earnmore thanwomen inessentially all societies.
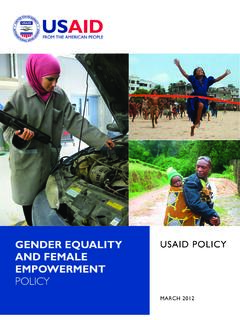
5 However, disparities in health, education, and bargaining power withinmarriage tend to be larger in Countries with low GDP per Education and HealthFigure 1ashows the ratio of the male and female college enrollment rates plotted against GDP percapita for Countries included in the World Bank s World Development Indicators (WDI) data relationship is downward sloping: The male bias in college-going falls (and in fact evaporates)as GDP increases. Although the correlation cannot be interpreted as a causal relationship, it isstrong: In a univariate regression of the college Gender ratio on log GDP per capita, theR2is ,equivalent to a correlation of A negative relationship between the schooling Gender gap andGDP is also seen for primary and secondary school enrollment (seeSupplemental Figure 1; followthe Supplemental Material link from the Annual Reviews home page ;theSupplemental Appendixalso describes the data in more detail).
6 As with many of thecross-country patterns shown below, thecollege-GDP relationship mirrorsthe time-series pattern seen within many Countries as their economies grow. The male to female1 ReadersarereferredtoDuflo (2012) on the bidirectional relationship between women s empowerment and development andto Doepke et al. (2012) on the link between legal rights for women and MaterialAnnu. Rev. Econ. :63-88. Downloaded from Access provided by Northwestern University on 10/30/17. For personal use only. ChinaIndia01234 Ratio of male to female tertiaryenrollment rate1,0004,00016,00064,000 GDP per capita (log scale)AmericasAsia and OceaniaEuropeMiddle East and N. AfricaSub-Saharan AfricaR2 = ,0004,00016,00064,000 GDP per capita (log scale)AmericasAsia and OceaniaEuropeMiddle East and N.
7 AfricaSub-Saharan of male to female life expectancyR2 = 1 Gendergapsin(a) education and (b) life expectancy. GDP per capita is the purchasing powerparity adjusted value in the year the outcome (the vertical-axis variable) is measured, expressed in 2011US dollars; data are from the World Bank s World Development Indicators (WDI). Outcome dataare from WDI. In this and subsequent figures, the circle size for each country is proportional to itspopulation (from WDI) in the year the outcome is measured, and the line shown is the best (unweighted)linear The Roots of Gender Inequality in Developing CountriesAnnu. Rev. Econ. :63-88. Downloaded from Access provided by Northwestern University on 10/30/17. For personal use only.
8 Ratio of college enrollment in the United States has declined steadily since 1950, falling belowparity by 1980 and continuing to decline since then (Goldin et al. 2006).2 InFigure 1a, the data points for China and India are given special attention both because theyare large together they are home to over one-third of the world s population and because theyare infamous for their strong son preference. Interestingly, in terms of school enrollment, neitherChina nor India is an to health, in general women have a longer life expectancy than men, but this femaleadvantageissomewhatsmallerinpoorco untries(Figure 1b). The pattern is not explained by thedisease composition varying with the level ofdevelopment; even for a given cause of death,women have higher age-adjusted mortality relative to men in poor Countries than in rich ones(Anderson & Ray 2010).
9 Most sub-Saharan African Countries are above the best-fit line inFigure 1b; the HIV/AIDS epidemic has hit Africa hard and has decreased female life EmploymentFigure 2aplots the ratio of the male and female labor force participation rates versus GDPper capita. The correlation is essentially zero. India stands out for the underrepresentationof women in the labor force ; men are three times as likely as women to be labor force participation (FLFP) is also abnormally low in the Middle East and though actual FLFP is not systematically higher in rich Countries , attitudes about womenin the labor force are more progressive in rich 2buses the World Values Survey(WVS), a set of nationally representative surveys fielded to both men and women; I use wave 5,conducted between 2004 and 2009, because wave 6 data for India was not yet available when thisarticle was written.
10 One of the survey questions asked respondents if they agreed or disagreed withthe statement on the whole, men make better business executives than women do. The poorerthe country, the more frequently respondents agreed with the statement. Because these are statedattitudes, an important caveat is that the pattern could partly just reflect a greater degree ofpolitical correctness in rich Gender -Based ViolenceAlthough there are no reliable data on the incidence of Gender -based violence to make cross-country comparisons, attitudes toward Gender -based violence vary systematically with eco-nomic development. One can see this using data from the Demographic and Health Surveys(DHS). One of the DHS questions asked female respondents age 15 49 whether and whena husband is justified in beating his wife.