Transcription of The SIPRI Top 100 arms-producing and military services ...
1 KEY FACTSw The arms sales of the SIPRI Top 100 arms-producing and military services companies (excluding China) totalled $ billion in 2017. This was per cent higher than sales in 2016 and marks the third consecutive year of growth in Top 100 arms sales. w Taken together, the arms sales of companies based in the United States grew by per cent in 2017. With 42 companies listed in 2017 4 more than in 2016 the US companies share of total Top 100 arms sales was 57 per cent in 2017. w The combined arms sales of West European arms producers grew by per cent in 2017, to $ billion. w The arms sales of the 10 Russian companies in the Top 100 rose by per cent in 2017. Total arms sales by Russian companies in the Top 100 for 2017 were second only to those of US A Russian company Almaz-Antey appears in the top 10 for the first Despite their continued growth, the combined arms sales of the Top 100 are only about one-sixth of the combined sales of the 15 largest manufacturing companies in the SIPRI TOP 100 ARMS PRODUCING AND military services COMPANIES, 2017aude fleurant, alexandra kuimova, nan tian, pieter d.
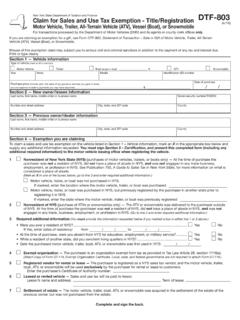
2 Wezeman and siemon t. wezemanSIPRI Fact SheetDecember 2018 Arms sales of the world s 100 largest arms-producing and military services companies (the SIPRI Top 100) totalled $ billion in 2017 (see annex 1).1 This was an increase of per cent compared with 2016 and marks the third consecutive year of growth in Top 100 arms sales (figures exclude China, see box 1). The arms sales of the Top 100 in 2017 were 44 per cent higher than those in 2002 (see figure 1). The overall growth in arms sales of the Top 100 in 2017 was driven by increases in arms procurement spending by several states, in particular the United States and Russia. 1 F or further detail on methodology see About the SIPRI Arms Industry Database in this fact sheet. The full data set is available on the SIPRI 1.
3 Total arms sales of companies in the SIPRI Top 100, 2002 17 Notes: Arms sales are defined as sales of military goods and services to military custom-ers domestically and abroad. The data in this graph refers to the companies in the SIPRI Top 100 in each year, so the data covers a different set of companies each year, except for 2016 and 2017, which refer to the set of companies listed in 2017. 2002 is the first year for which SIPRI has sufficient data to include Russian companies in its Top 100 lists. Source: SIPRI Arms Industry Database, Dec. (2017) US$Current US$Total arms sales (US$ b.)0100200300400500201720162015201420132 0122011201020092008200720062005200420032 0022 SIPRI fact sheetDEVELOPMENTS IN THE TOP 100 The Top 100 companies are ranked by their total annual arms sales.
4 As has been the case every year since 2002, companies based in the USA and Western Europe continued to dominate the Top 100 in 2017: a total of 66 US and West European companies are listed. Their combined arms sales of $ billion were per cent higher than in 2016, and together they accounted for 81 per cent of Top 100 arms sales in combined arms sales of West European arms pro ducers in the Top 100 grew by per cent in 2017, to $ billion. The arms sales of com-panies based in the United Kingdom were the highest in Western Europe ($ billion in 2017), accounting for per cent of the Top 100 total in 2017 (see figure 2). Between 2002 and 2016, the annual combined arms sales of British companies in the Top 100 were second only to those of US companies.
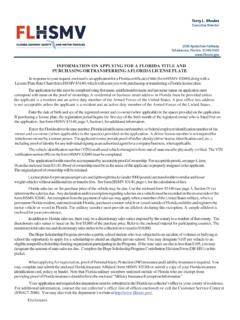
5 However, in 2017 Russia was the second largest arms producer in the Top 100: the combined arms sales of Russian companies ($ billion) accounted for per cent of the Top 100 total in arms sales of the 10 largest companies in the Top 100 amounted to $ billion in 2017 an increase of 10 per cent ($ billion) compared with their arms sales in 2016. The top 10 accounted for 50 per cent of total Top 100 arms sales in 2017. Notably, 2017 was the first year that a Russian company appeared in the top 10: Almaz-Antey, which ranked 10th, is also the first company based outside the USA or Western Europe to be ranked in the top 10. Five US and four West European companies occupied the other nine positions in the top 10 in ARMS PRODUCING COUNTRIESThe United StatesThe combined arms sales of the 42 USA-based companies in the Top 100 grew by per cent in 2017, to $ billion, accounting for 57 per cent of the overall total (see figure 3).
6 Considering the volume of US arms sales and the number of companies ranked in 2017, the USA will continue to be the world s largest producer of arms for the foreseeable Martin remains, by far, the largest arms producer in the world, with arms sales of $ billion in 2017 an increase of per cent compared with 2016. The increase was mainly due to ongoing deliveries of F-35 combat aircraft, missiles and anti-missile systems, and Aegis naval combat systems. The growth in Lockheed Martin s arms sales and the 11 per cent drop in those of Boeing widened the gap between the top two arms pro ducers to Box 1. Chinese arms-producing companiesChinese arms-producing companies are not covered by the SIPRI Top 100 due to the lack of data on which to make a reasonable or consistent estimate of arms sales dating back to 2002.
7 Nonetheless, some information is available on several major companies that are part of the mainly state-owned Chinese arms estimates that three Chinese arms companies would be ranked in the top 10 of the Top 100 arms-producing and military services companies: AVIC with arms sales of $ billion, NORINCO with $ billion and CETC with $ billion. Based on the limited information available and taking into account arms exports and the general growth in China s military spending, at least seven other arms companies would probably be in the Top 100 if figures for arms sales were SIPRI top 100 arms-producing companies, 2017 3$ billion in 2017. The fall in Boeing s arms sales can be partially attributed to delays in the delivery of KC-46 tanker aircraft and the end of deliveries of C-17 transport There were several large mergers and acquisitions by US companies in 2017.
8 The acquisitions of Rock-well Collins by United Technologies and of Orbital ATK by Northrop Grumman were particularly note-worthy. The buying companies may have made the acquisitions with the aim of gaining an advantage against their competitors in the upcoming major arms- acquisition programmes announced by the USA in 2016 and 2017, which will include the mod-ernization of US nuclear forces. In contrast, the recent trend in consolidations of US military services companies slowed in 2017. In the past few years some of the larger arms- producing companies have spun off their military services activities in order to focus on their core capabilities and often also because the growth in revenue from such activities was far lower than anticipated.
9 In many cases, the resulting smaller companies have then merged into larger military services companies. However, the only example of this in 2017 was the formation of DXC (ranked 82nd in the Top 100), following the merger of Computer Sciences Cor por-ation and relevant parts of Hewlett Packard Enter-prise services business. Western EuropeThe combined arms sales of the seven British companies in the Top 100 amounted to $ billion in 2017 an increase of per cent compared with 2016, largely due to increases in the arms sales of BAE Systems, Rolls-Royce and GKN (see annex 1). BAE Systems, which is ranked fourth in the Top 100, remains the UK s biggest arms producer. Its arms sales rose by per cent, to $ billion in 2017.
10 BAE Systems is a clear example of an international-ized arms-producing company: 29 000 of its 83 000 personnel are employed by a US subsidiary. GKN s arms sales rose by 20 per cent in 2017 the highest annual increase among British companies. This was the second consecutive year of double-digit growth in GKN s arms sales, which is due to high global demand for its aircraft components. In contrast, the arms sales of Babcock International which is involved in the maintenance and production of Brit-ish Navy ships including new nuclear submarines fell by per cent in 2017 after two consecutive years of significant growth. This was mostly due to a slowdown in domestic procurement. 2 A s Boeing altered its reporting in 2017, the method used to estimate its arms sales has changed compared with 2016, which may also explain the difference between the 2 2.