Transcription of The State of the Poor: Where are the Poor and ... - World Bank
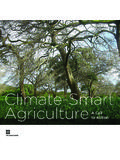
1 1 The State of the poor : Where are the poor and Where are they Poorest?1 Extreme poverty in the World has decreased considerably in the past three decades (figure 1). In 1981, more than half of citizens in the developing World lived on less than $ a day. This rate has dropped dramatically to 21 percent in 2010. Moreover, despite a 59 percent increase in the developing World s population, there were significantly fewer people living on less than $ a day in 2010 ( billion) than there were three decades ago ( billion). But billion people living in extreme poverty is still a extremely high figure, so the task ahead of us remains herculean. To accelerate poverty reduction and end extreme poverty by 2030, we need to know who are the poor , Where do they live, and Where poverty is deepest. How have the different regions of the developing World performed in terms of extreme poverty reduction? Extreme poverty headcount rates have fallen in every developing region in the last three decades.
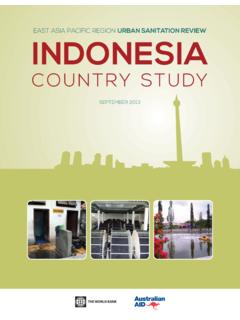
2 And both Sub Saharan Africa (SSA) and Latin America and the Caribbean (LAC) seem to have turned a corner entering the new millennium. After steadily increasing from 51 percent in 1981 to 58 percent in 1999, the extreme poverty rate fell 10 percentage points in SSA between 1999 and 2010 and is now at 48 percent an impressive decline of 17 percent in one decade. In LAC, after remaining stable at approximately 12 percent for the last two decades of the 20th century, extreme poverty was cut in half between 1999 and 2010 and is now at 6 percent. Fig 1: The Evolution of Extreme Poverty Rates by Region Source: World bank staff estimates. 1 Draft. Prepared by Pedro Olinto and Hiroki Uematsu, Poverty Reduction and Equity Department 8461212106066515260482126516257433635412 5464458341213162332648210102030405060708 090 ChinaEAP without ChinaEurope and Central AsiaLatin America and the CaribbeanMiddle East and North AfricaIndiaSouth Asia without IndiaSub Saharan AfricaDeveloping WorldExtreme Poverty Rates (%)19811990199920102 However, despite its falling poverty rates, Sub Saharan Africa is the only region in the World for which the number of poor individuals has risen steadily and dramatically between 1981 and 2010 (figure 2).
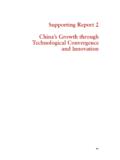
3 There were more than twice as many extremely poor people living in SSA in 2010 (414 million) than there were three decades ago (205 million). Fig 2: Number of Extremely poor Individuals by Region (million) Source: World bank staff estimates. As a result, while the extreme poor in SSA represented only 11 percent of the World s total in 1981, they now account for more than a third of the World s extreme poor (figure 3). India contributes another third (up from 22 percent in 1981) and China comes next contributing 13 percent (down from 43 percent in 1981). 8357205866836334434463632121731562612502 6224323819720916012011190435349535354606 3483732429427443448462463473484466445400 1401471501691701671471561321261072052392 5729033034937639039539941402004006008001 0001200140016001800200019811984198719901 993199619992002200520082010 Number of poor by Region (million)ChinaEAP without ChinaEurope and Central AsiaLatin America and the CaribbeanMiddle East and North AfricaIndiaSouth Asia without IndiaSub Saharan Africa3 Figure 3.
4 Regional shares of the World s extreme poor population Source: World bank staff estimates. How poor are the extremely poor ? Have they become poorer in the last three decades? Figure 4 plots the average daily per capita income of the extremely poor in the developing World as a whole, in the Sub Saharan Africa region, and in the developing World excluding Sub Saharan Africa. As shown, the average income of the extremely poor in the developing World has been rising and steadily converging to the $ per day poverty line. In 2010, the average income of the extremely poor in the developing World was 87 cents per capita per day, up from 74 cents in 1981 (in 2005 US dollars). If the extreme poor in Sub Saharan Africa were not included, the average income of the World s poor would have converged even faster to the $ line (figure 4). This increase in incomes of the extreme poor is unfortunately not seen in Sub Saharan Africa.
5 Between 1981 and 2010, the average income of the extremely poor has remained flat at approximately half of the $ line in that region. 4339333633262622151313131315131212121099 7233333343332223252324272730343433788991 0810910911131515172022242831340%10%20%30 %40%50%60%70%80%90%100%19811984198719901 993199619992002200520082010 Regional Share of The World 's Extreme poor Population (%)ChinaEAP without ChinaEurope and Central AsiaLatin America and the CaribbeanMiddle East and North AfricaIndiaSouth Asia without IndiaSub Saharan Africa4 Where is extreme poverty deepest and therefore hardest to end? Accelerating extreme poverty reduction is a huge challenge in both sub Saharan Africa and South Asia, given that there are approximately 400 million and 500 million extreme poor people in these regions respectively. The depth of extreme poverty is commonly measured by the extreme poverty gap. When expressed in dollars based on Purchasing Power Parity (PPP) calculations, the extreme poverty gap represents the average amount of additional daily income needed by the extremely poor to reach the poverty line of $ per day.
6 Thus, from figure 4, we can see that the average gap of the extremely poor in the World is 38 cents per day, or approximately $140 per year in 2005 PPP dollars. Since there are billion extremely poor individuals in the World , the aggregate global extreme poverty gap amounts to approximately $169 billion dollars in 2005 PPP dollars, or approximately $197 billion in 2010. That is, if the incomes of every extremely poor person were to rise to the $ line, the aggregate increase in their income would need to total at least $169 billion dollars in 2005 PPP terms. We call this number the aggregate extreme poverty gap. This represents approximately percent of global GDP. It is important to note that extreme poverty gap is the conceptual amount of direct additional income an average extremely poor person would need to get to $ per day and is not indicative of the level of assistance required to close the gap.
7 The aggregate global extreme poverty gap in 2010 was less than half the gap in 1981 ($362 billion in 2005 PPP terms), a faster reduction than the reduction in the number of poor . Figure 4. The evolution of the average per capita income of the extreme poor Source: World bank staff estimates. $ $ $ $ 1984 1987 1990 1993 1996 1999 2002 2005 2008 2010 Average per capita Income of the Extreme PoorSub Saharan AfricaDeveloping WorldDevelopment World without Sub Saharan Africa