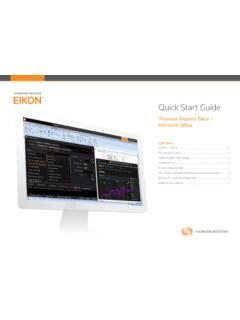
Transcription of THOMSON REUTERS DATASTREAM
1 THOMSON REUTERS DATASTREAM is designed for the strategist, economist and research communities, offering the world s most comprehensive financial historical database with time series content available from the 1950s. It enables you to explore relationships between data series, perform correlation and relationship analysis, test investment and trading ideas, research countries, regions and industries. With this vast database you can get a full picture of the macro environment and better understand economic cycles to uncover trends and forecast market conditions.
2 The DATASTREAM database has over 35 million individual instruments or indicators across all major asset classes. INTERNATIONAL MACROECONOMICSOver million active indicators are available providing headline and nationally sourced indicators. Our history can extend as far back as the 1950s for G7, 1970s for other major markets, and 1980s for smaller countries. Economic profiles of 162 countries from national, primary sources. These include government agencies (central statistical offices and ministries), central banks, and public or private institutions who compile indicators of renown.
3 Coverage extends from the headliners to include series from all major economic news releases, as well as other important publications or national databases. Comparable data from international organizations for worldwide perspective and coverage of 215 countries. Historical macro content is available from the International Monetary Fund (IMF), World Bank, and Organisation for Economic Co-operation and Development (OECD). Historical micro content is available from a number of industry sources such as British Petroleum for world energy and THOMSON REUTERS GFMS for gold statistics.
4 Forecast series are supplied by leading authorities - the Economist Intelligence Unit, Consensus Economics, World Bank, and OECD. VIEW ECONOMIC DATA AS IT WAS ORIGINALLY REPORTED Our economics point in time data enables you to view economic data as it was originally reported upon release, then view how it changed over time. This information helps you more accurately understand the impact economic data has on the market, which supports your history analysis and back testing needs so that you can better understand how likely your investment strategy is to succeed.
5 Over 1,800 economics point in time series from 10 years+ of history are included, for key G7 REUTERS DATASTREAM UNRIVALLED, HISTORIAL FINANCIAL DATAF inancial Surplus or Deficit by SectorINTERNATIONAL COMPARABLE ECONOMICS This proprietary data set provides standardized versions of 51 key indicators for up to 130 countries so you can more easily compare different economies in your research. Originally published by national sources, the data is adjusted to equivalent statistical form and released on the day of the relevant data for over 103,000 active equities plus over 166,000 inactive equities covering 100 developed and emerging markets with over 200 fields including prices, volumes, market capitalization, earnings, dividend and corporate action data, plus classification data based on ICB.
6 For many markets, there is full coverage of all traded equity instruments with over 50 years of history for the key developed markets. Data is sourced direct from exchanges, leading international and local suppliers, and published 2 Equity IndicesHistorical data for over 340,000 equity indices, which includes extensive coverage of market indices for 68 countries and emerging markets. Comprehensive equity index and constituent data is provided for the major index suppliers such as MSCI, FTSE Russell, S&P, Dow Jones and STOXX. Historical constituent lists and weights data is provided for many developed and emerging market local indices.
7 Global equity indices span over 30 years of daily index history and cover 55 markets, 32 regions and 170 sectors (ENVIRONMENTAL, SOCIAL AND GOVERNANCE) THOMSON REUTERS has in-depth coverage across 7,000+ global companies and over 400 metrics with history back to 2002. We also provide 14+ years of history on over million officers and directors for over 80,000 public companies and over million officers and directors for 135,000 private ESTIMATES Consensus level estimates content is sourced from THOMSON REUTERS I/B/E/S Estimates and provides access to 30 measures, including earnings, profits, sales and price targets.
8 Covering more than 22,000 active and 40,000 inactive companies worldwide, from 920 contributors, across over 100 developed and emerging estimates data provides: Powerful aggregates for country, index, sector and industry level providing insight into areas with highest expected growth, associated risk and an indication of relative valuation. Extensive quality control, guaranteed consistency and proactive enhancements. Unrivalled history which dates back to 1976 for the US, 1985 for Canada, 1987 for EMEA and ConfidenceConsumer SentimentEstimates IndicesThomson REUTERS I/B/E/S Global Aggregates provide a unique source of data for global investment applications, enabling key valuation comparisons across markets; includes earnings forecasts on over 17,500 indices, markets, regions, industries and sector fundamental data and financial ratios are available for all developed markets and key emerging markets.
9 Access 8,000 data items with coverage of over 50,000 active quoted companies and over 35,000 inactive companies across 125 markets. FUNDS AND INVESTMENT TRUSTST homson REUTERS offers extensive global coverage of historical end of day funds data, with over 30 years of history and a range of measures including net asset value, dividends, performance measures and supporting data such as classifications and identifiers all sourced directly from THOMSON REUTERS can access daily estimated net asset values (NAVs) for UK sterling Investment Trusts.
10 NAVs are estimated twice daily to capture real-time and closing market prices. Associated sector indices are also calculated daily. As well as current estimates, the database provides comprehensive historical published NAV data and historical estimates where published data is Indices THOMSON REUTERS LipperOver 700 indices sourced from Lipper are available for benchmarking. The Lipper indices include Lipper US indices, Global Classification indices, plus Lipper Investment Association indices; these indices complement the Lipper funds data already available on DATASTREAM ; they allow you to analyse an individual fund s performance against corresponding indices and may be used to describe the returns an investor could reasonably have expected in the past.