Transcription of Titration Method Validation - USP
1 Recommendations for Titration methods Validation Margareth Marques,1* Horacio Pappa,1 Michael Chang,1 Lori Spafford,2 Michael Klein,3 Lucia Meier3. 1. Pharmacopeia 2. Metrohm USA. 3. Metrohm International Headquarters, Switzerland *Corresponding author: Introduction The objective of Validation of an analytical procedure is to demonstrate that it is suitable for its intended purpose. Recommendations for the Validation of analytical methods can be found in ICH Guidance Q2(R1) Validation of Analytical Procedures: Text and Methodology (1) and in USP General Chapter <1225> Validation of Compendial Procedures (2). The objective of this paper is to provide some recommendations for the Validation of Titration methods . Standardization For Method Validation in Titration , titrant Primary standards fulfill several criteria, which standardization is the first step to obtaining the makes them ideal for the standardization of titrants.
2 Most reliable results. Dilution and weighing Primary standards are of: errors when preparing a titrant can lead to - High purity and stability deviations between the nominal titrant concentration and the exact titrant concentration. - Low hygroscopy (to minimize weight changes). Furthermore, all titrants (including commercially - High molecular weight (to minimize weighing available titrants) will age over time, leading to a errors). change in the titrant concentration. Titrant Additionally, they are traceable to standard reference standardization is therefore paramount, even if materials ( , NIST traceable). commercially available titrants are used. Additionally, the result of the standardization can be used to assess the system suitability. For standardization, either a primary standard or a pre-standardized titrant is used. In either case, the standardization step needs to be performed at the same temperature as the sample Titration , since the temperature influences titrant density.
3 Titrants expand in volume at higher temperatures, and thus their titer factor decreases accordingly. Standardization procedures for the various titrants are described in the Volumetric Solution section of the USP - NF (3). Specificity Specificity is the ability to assess the analyte without any interference from other components that might be present in the sample. Other components could include impurities, excipients, or degradation products. It is therefore necessary to show that the analytical procedure is not affected by such compounds. This can be achieved by 1. spiking the sample with impurities or excipients and demonstrating that the result is unaffected. For Titration , this means that either the found equivalence point (EP) is not shifted by the added impurities or excipients, or if it is shifted, that a second EP can be observed that corresponds to these added components when using a potentiometric sensor for indication.
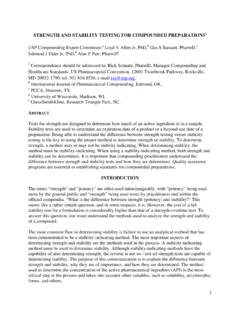
4 If color indicators are used for end point indication and a shift is observed, demonstration of the specificity can be achieved by a second Titration with another suitable color indicator. In some cases, Titration is not specific. An example is when the assay of a substance is done by non-aqueous Titration , and impurities or degradation products have a similar pKa value to the substance of interest. In such cases, specificity needs to be complemented by other techniques. Using the assay of potassium bicarbonate by Titration with hydrochloric acid (4) as an example, the expected impurity is potassium carbonate. The pKb values for potassium carbonate are at approximately and , meaning it is possible to separate both species during an acid-base Titration . To demonstrate this, pure potassium bicarbonate as well as a sample spiked with potassium carbonate were titrated with 1 N hydrochloric acid VS.
5 Figure 1 shows a curve overlay comparing the Titration curves of potassium bicarbonate both with and without added potassium carbonate impurity. The Titration curves for potassium bicarbonate alone clearly exhibit only one EP for potassium bicarbonate, while the Titration curves for the solution with potassium bicarbonate and potassium carbonate have two EPs. The first equivalence point corresponds to the added potassium carbonate, while the second one corresponds to the sum of potassium bicarbonate and potassium carbonate. Curve overlay Pot EP 1 EP 22. EP 1 EP. EP 1. -1 0 1 2 3 4 5 6 7 8 9 10 11 12 13 14 15 16 17 18 19. Volume mL. Figure 1. Curve overlay of the specificity test using 1 g KHCO3 with and without g K2CO3 (green and orange = no K2CO3 added; blue and yellow = K2CO3. added). 2. Linearity The results of a linear analytical procedure are proportional to the concentration of the analyte, either directly or by a well-defined mathematical transformation within a given range.
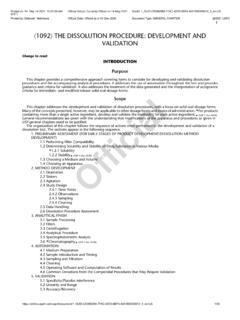
6 As Titration is an absolute Method , the linearity can usually be obtained directly. For this, at least five different concentrations are titrated and a linear regression of the sample size versus the consumed Titration volume is established. To evaluate the linearity, the coefficient of determination (R2) is used. The recommendation is to use a concentration range from 80% to 120% of the intended assay weight (2). For the potassium bicarbonate example, five different weights ranging from 50% to 150% of the assay weight were analyzed in duplicate. The results are listed in Table 1, and the linear regression plot is shown in Figure 2. With an R2 of over a weight range from 50% to 150%, the assay of potassium bicarbonate by Titration with hydrochloric acid is highly linear. Table 1. Linearity determination for the assay of potassium bicarbonate Sample weight (%) Sample weight (g) Equivalence Point Assay (%).
7 For linearity volume (mL). 50 50 75 75 100 100 125 125 150 150 3. Linear regression for potassium bicarbonate 18. 16. y = + R = 14. 12. EP volume (mL). 10. 8. 6. 4. 2. 0. 0 1 Sample size (g). Figure 2. Linear regression curve for the assay of potassium bicarbonate Accuracy and Precision Accuracy is defined as the closeness of the result to the true value. The accuracy contains the information of the bias of a Method and should be established over the complete determination range. Also, the accuracy determination of assays is different from impurity tests. For assays, a reference substance of known purity is analyzed, while for impurity tests, the sample is spiked with known quantities of the impurity. The accuracy is then calculated from the recovery of the analyte. Precision contains the information regarding how well the individual results agree within an analysis of a homogeneous sample.
8 The precision is usually expressed as standard deviation (SD) or relative standard deviation (RSD). Precision is evaluated in three levels: repeatability, intermediate precision, and reproducibility. Repeatability refers to the precision obtained by a single analyst for the same sample in a short period of time using the same equipment for all determinations. Intermediate precision can be determined by the analysis of the same sample on different days, by different analysts and different equipment, if possible, within the same laboratory. Reproducibility refers to the precision obtained by analysis of the same sample across different laboratories. The reproducibility is usually obtained by performing inter-laboratory studies (ILS). For the precision determination, it is important that not only the analysis itself but also all sample preparation steps are done independently for each analysis.
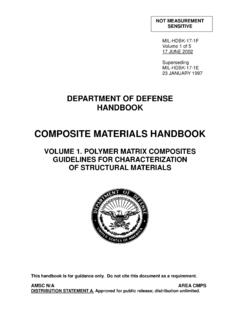
9 The determination of both accuracy and precision is required because only the combination of both factors ensures that correct results are obtained (Figure 3). 4. Figure 3. Only when both precision and accuracy are high can correct results can be obtained, as high precision does not necessarily mean good accuracy, and vice versa For Titration , accuracy and repeatability are usually determined together. At least nine determinations at three different concentration levels are recommended for determination of both parameters. In the case of potassium bicarbonate, 80%, 100%, and 120% of the sample weight suggested in the assay were used. A potassium bicarbonate sample of known purity was used for the analysis, and each sample weight was titrated in triplicate. The results are shown in Table 3. With a relative standard deviation of over all nine determinations, the required precision is met.
10 The obtained assay is close to the manufacturer's certificate of analysis ( ) with a mean value of , fulfilling the requirements for accuracy. 5. Table 1. Results of the accuracy and precision determinations for potassium bicarbonate Determination Sample Sample EP volume Assay (%). weight (%) weight (g) (mL). for linearity 1 80 2 80 3 80 4 100 5 100 6 100 7 120 8 120 9 120 Mean SD RSD To determine the intermediate precision for the potassium bicarbonate assay, the precision and accuracy determinations were repeated on a different day on different equipment. The results are shown in Table 4. The required precision is met, with a relative standard deviation of over all nine determinations. Table 2. Results of the intermediate precision determination for potassium bicarbonate Determination Sample Sample size EP volume Assay (%). weight (%) (g) (mL).