Transcription of Topic Check In - 12.02 Interpreting and representing data
1 Topic Check In - Interpreting and representing data 1. This pie chart shows the colour of hats that Tom owns. Which colour hat does he own most of? Colour of Tom's hats Blue Yellow Red Green 2. What percentage of Tom's hats are blue? 3. This pictogram shows how many laptops were sold by a company during one week. Monday Key: represents 10 laptops Tuesday . Wednesday . Thursday . Friday . How many laptops were sold on Tuesday? 4. Ken recorded the number of cars he sold in one week. Colour of car Frequency Blue 5. Silver 3. White 1. Red 3. Other 2. How many cars did he sell altogether? 5. Some people were asked which of football, tennis or cricket was their favourite sport. This bar chart shows the results. Favourite Sport 70. 60. 50 Football 40 tennis 30. Cricket 20. 10 Series4. 0. Men Women Children Which sport was most popular with women? 6. Kate says, Most of the men who were asked said that they liked football best.
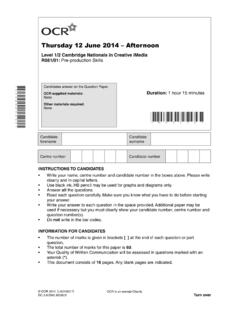
2 Is Kate right? Explain your answer. 7. Which of the bar charts represents the data given in the frequency table? Bar chart A. Frequency Age of Customers Frequency 60. Age Men Women 50. 18 10 15. 40. 19 30 20 Women 30. 20 20 20. 20 Men 21 10 15. 10 Series3. over 21 5 25 0. 18 19 20 21 over 21. Age Bar chart B Bar chart C. Age of Customers Age of Customers Frequency 70 Frequency 60. 60 50. 50. 40. 40. Women 30 Women 30. Men 20 Men 20. 10 Series3 10 Series3. 0 0. 18 19 20 21 over 21 18 19 20 21 over 21. Age Age 8. These pie charts show how people travel to work in two towns. The populations of the towns are given. car bike walk train Town A Town B. (population 2000) (population 10 000). In which town do more people travel to work by bike? Explain your answer. 9. A dice is rolled 100 times. Dice Scores This bar chart shows the results. 45. Frequency 40. 35. How many more 2s than 5s were 30. thrown?
3 25. 20. 15. 10. 5. 0. 1 2 3 4 5 6. Number on Dice 10. The graph below shows the percentage of time that 8 competitors spent on each of the 3 triathlon events: Swimming, Cycling and Running. %. 0 10 20 30 40 50 60 70 80 90 100. A. B. C. D. Competitor E. F. G. H. Swimming Cycling Running Which competitor spent 55% of their time cycling? Extension This is a bar chart but the title and labels for both axes are missing. What data do you think it might be representing ? Write down as many ideas as you can for the data that it might represent. For each idea suggest a title for the graph and labels for both axes. Answer 1. Yellow 2. 25%. 3. 15. 4. 14. 5. tennis 6. No, 90 men were asked in total and 50 did not choose football, which is over half. 7. Graph C. 8. Town B because although the sector is smaller, the population is much larger. 9. 20. 10. F. Extension Possible suggestions include hours of sunshine, number of people cycling to work/school, sales of ice creams, etc.
4 We'd like to know your view on the resources we produce. By clicking on the Like' or Dislike'. button you can help us to ensure that our resources work for you. When the email template pops up please add additional comments if you wish and then just click Send'. Thank you. OCR Resources: the small print OCR's resources are provided to support the teaching of OCR specifications, but in no way constitute an endorsed teaching method that is required by the Board, and the decision to use them lies with the individual teacher. Whilst every effort is made to ensure the accuracy of the content, OCR cannot be held responsible for any errors or omissions within these resources. We update our resources on a regular basis, so please Check the OCR website to ensure you have the most up to date version. OCR 2015 - This resource may be freely copied and distributed, as long as the OCR logo and this message remain intact and OCR is acknowledged as the originator of this work.
5 OCR acknowledges the use of the following content: Maths and English icons: Air0 Assessment Assessment Qu. Topic R A G Qu. Topic R A G. Objective Objective AO1 1 Find mode from pie chart. AO1 1 Find mode from pie chart. AO1 2 Express pie chart data as percentages. AO1 2 Express pie chart data as percentages. AO1 3 Interpret pictogram data. AO1 3 Interpret pictogram data. AO1 4 Summarise data from frequency table. AO1 4 Summarise data from frequency table. AO1 5 Find mode from multiple bar chart. AO1 5 Find mode from multiple bar chart. AO2 6 Interpret data displayed in multiple bar chart. AO2 6 Interpret data displayed in multiple bar chart. AO2 7 Interpret frequency data in tables and charts. AO2 7 Interpret frequency data in tables and charts. AO2 8 Compare pie charts. AO2 8 Compare pie charts. AO3 9 Interpret data from bar chart. AO3 9 Interpret data from bar chart. AO3 10 Interpret data displayed in graph.
6 AO3 10 Interpret data displayed in graph. Assessment Assessment Qu. Topic R A G Qu. Topic R A G. Objective Objective AO1 1 Find mode from pie chart. AO1 1 Find mode from pie chart. AO1 2 Express pie chart data as percentages. AO1 2 Express pie chart data as percentages. AO1 3 Interpret pictogram data. AO1 3 Interpret pictogram data. AO1 4 Summarise data from frequency table. AO1 4 Summarise data from frequency table. AO1 5 Find mode from multiple bar chart. AO1 5 Find mode from multiple bar chart. AO2 6 Interpret data displayed in multiple bar chart. AO2 6 Interpret data displayed in multiple bar chart. AO2 7 Interpret frequency data in tables and charts. AO2 7 Interpret frequency data in tables and charts. AO2 8 Compare pie charts. AO2 8 Compare pie charts. AO3 9 Interpret data from bar chart. AO3 9 Interpret data from bar chart. AO3 10 Interpret data displayed in graph. AO3 10 Interpret data displayed in graph.