Transcription of Towards A Periodic Table of Visualization Methods …
1 To w a r d s A P e r i o d i c Ta b l e o f Visualization Methods for Management Ralph Lengler & Martin J. Eppler Institute of Corporate Communication University of Lugano, Switzerland ABSTRACT In this paper, we describe the effort of defining and com-piling existing Visualization Methods in order to develop a systematic overview based on the logic, look, and use of the Periodic Table of elements. We first describe the cur-rent fragmented state of the Visualization field. Then we outline the rules and criteria we applied in conducting our research in order to present a revised Periodic Table of 100 Visualization Methods with a proposition how to use it. KEY WORDS knowledge Visualization , knowledge Visualization meth-ods, Periodic Table , problem solving, classification, selec-tion framework, visualisation types 1 The Realm of Visualization Methods The discipline of Visualization studies is an emergent one and as such represents a so far still highly unstructured domain of research that includes scholars from such dis-tant domains as human-computer interaction, graphic design, management, or architecture.
2 Thus, there are many parallel, unconnected streams and development activities in this field that may move forward without mutually acknowledging or integrating efforts under way elsewhere. In order to contribute to the consolidation of these efforts and to the emergence of a distinct field that achieves cumulative research progress this article pro-poses an integrative overview on one aspect of the visu-alization field, namely the development of easily applica-ble Visualization Methods , that is to say systematic graphic formats, that can be used to create, share, or cod-ify knowledge (in the sense of insights, experiences, con-tacts, or skills). In this paper, we present a simple struc-ture, inspired by the use, look, and logic of the Periodic Table of elements developed in the domain of chemistry.
3 There are numerous benefits that can be achieved through such a structure: First, it can provide a descriptive over-view over the domain [1, p. 12] and can function as an inventory or repository like a structured toolbox. In this way this structure can also become a problem solving heuristic [2, p. 68] that relates possible Visualization Methods to Visualization challenges. Thus this structure reduces the complexity inherent in choosing a visualiza-tion method for a particular application context. As a further benefit, it helps to recognize the similarities and differences among different types of Visualization meth-ods as well as to compare different types of Visualization Methods along pertinent criteria. Its main purpose is therefore to be user-centered in its focus to assist re-searchers and practitioners in identifying relevant visuali-zation Methods and assess their application parameters.
4 Our understanding of a Visualization method is, in a first step, an ample one, as we strive to develop a preliminary broad compilation of Methods (that employ visual means to structure information). We use the following general formula as a working definition for Visualization Methods : A Visualization method is a systematic, rule-based, external, permanent, and graphic representation that depicts information in a way that is conducive to acquiring insights, developing an elaborate un-derstanding, or communicating experiences. Prototype members of this category of elaborate visuali-zation tools are, in our view, Methods (from realms as diverse as education, requirements engineering and argu-mentation theory) such as concept mapping, evocative knowledge diagrams, argumentation diagrams, or rich visual metaphors. In this paper, however, we only focus on Methods with potential applicability in the realm of management.
5 In management the key for better execution is to engage employees. To succeed the communicator not only needs to convey the message, but also needs to tailor it to the recipient s context, so that he can re-construct the knowledge, integrate it and put it to meaningful action. Therefore we see a high potential of complimentary visu-alizations to engage different stakeholders. Unfortunately in management very few Visualization Methods are used, and little is known about Visualization Methods of other domains with potential to management, their require-ments, benefits and application areas. 2 Methodology: Identifying, Selecting, and Organizing Visualization Methods The methodology that we have applied for this paper can be separated into three steps. The first step consisted of identifying potential candidates for inclusion in the visu-alization compilation.
6 The second step consisted of select-ing those Methods that best meet the requirements of Visualization for the realm of management. The third step consisted of structuring the compiled Methods in a logical and accessible way. With regard to the first step we have consulted the following sources to gather Visualization Methods : Websites focusing on compilations of visual Methods for problem solving, learning, or man-agement (such as , , , , etc.) Seminal books focusing on visual Methods (such as the works of Tufte [3, 4, 5], Wurman [6], Chen [7], Mok [8], Horn [9, 10], and others) Articles from scientific journals in the areas of management, psychology, education, computer science, design, or philosophy proposing, dis-cussing, or applying visual Methods In these sources we have found approximately 160 visual Methods .
7 We have reduced these to a set of a hundred Methods , by applying the following selection criteria: 1. The method must be fully documented in all its steps. 2. The method must have been previously applied in real-life, preferably organizational, settings. 3. The method must be fit to represent knowledge-intensive, complex issues. 4. The method must be applicable by non-experts. 5. The method should have been evaluated before in some way or other. The resulting hundred visual Methods that have met these criteria were then analyzed with regard to the following properties: graphic format employed ( , quantitative chart, qualitative diagram, cartographic map, visual meta-phor, tables) , typical content type ( , concepts, prob-lems, people), application context ( , management, engineering, counseling etc.) and scope (narrow vs. wide), difficulty of their application, originating discipline, vicin-ity over overlaps to other visual Methods .
8 We have derived these distinguishing dimensions from existing Visualization taxonomies [11, 12, 13, 14] and consequently use them as candidates for organizing prin-ciples in our Periodic Table of Visualization method. It was central in our classification effort to find dimen-sions with a granularity that fit managers: They should be easy to use and have proven benefits. The dimensions should address challenges related to managerial thinking (cognitive challenges), managerial communication and coordination (social challenges), and the managers abil-ity to motivate and engage their peers and employees (emotional challenges). The visual representation of in-formation, on the other hand offers many cognitive ( , perspective switching [25]), emotional ( , create in-volvement and engage people s imagination [26]) and social ( , ideally suited for communication and presen-tation purposes [9]) advantages that can be put to use in management.
9 The organization principles should also relate to the situation in which the Visualization is used (when?), the type of content that is represented (what?) the expected Visualization benefits (why?), and the actual Visualization format used (how?) [20]. We then classified the visualiza-tion Methods according to those challenges and require-ments and came up with the following five dimensions. Complexity of Visualization : Low to High, refer-ring to the number of rules applied for use and/or the number of interdependences of the elements to be visualized. Main Application or Content Area [how?, what?]: Data, Information, Concept, Meta-phor, Strategy, Compound Knowledge. Fur-thermore members of this group can also be ranked according to their knowledge intensity, going from explicit, objective knowledge visu-alizations (like Data Visualization ) to more tacit, subjective knowledge visualizations (like Com-pound Knowledge Visualization ).
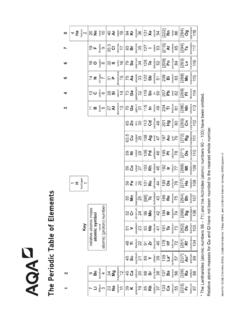
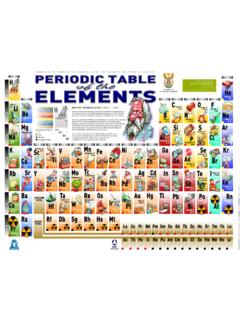
10 Point of View [when?]: Detail (highlighting in-dividual Items), Overview (big picture), Detail and Overview (both at the same time). Type of Thinking Aid [why?]: Convergent (re-ducing complexity) vs. Divergent (adding com-plexity). Type of Representation [what?]: Process (step-wise cyclical in time and/or continuous sequen-tial), Structure ( , hierarchy or causal net-works) Then we organized these dimensions in an easily accessi-ble Table reminiscent of the Periodic Table of Elements, thus signaling the main purpose of meaningfully organiz-ing elements that can be combined for use. 3 The Periodic Table of Elements The Periodic Table of the chemical elements is a tabular form of displaying the chemical elements, first devised in 1869 by the Russian chemist Dmitri Mendeleev. Men-deleev conceived the Table to illustrate recurring ("peri-odic") trends in the properties of the elements.
