Transcription of Tracer Studies in a series system of Continuous Stirred ...
1 Tracer Studies in a series system of Continuous Stirred Tank Reactors (CSTRs): Comparison of Pulse and Step Input Experiments with Theoretical Models. Group members: Course: ENE 806 (Spring 2010) Instructor: Dr. Syed Hashsham Abstract: Continuously Stirred tank reactor (CSTRs) are widely use in water treatment utilities, both in chemical (Kumar and Goel 2010, Sahinkaya 2009) and biological processes (Hong et al. 2009, Stamatelatou et al. 2009). Tracer Studies are conducted to monitor the performance of CSTRs, by comparing actual experimental data with theoretical models (Chapra 2003). Two types of Tracer Studies , pulse input and step input, were carried out in a six-CSTRs- series setup. Two theoretical models were used to predict the results of pulse and step input experiments. While the shape of the concentration curves from the experiments closely matched those predicted by the models, it was observed that the concentrations were lower than the expected values.
2 It was also seen that the peaks in concentration occurred earlier in the actual experiments. The primary reason for the differences was attributed to fluctuations in the flow rate and inefficiency in mixing. Improved flow control measures and better mixing are expected to yield better results. Introduction: Reactors are used in both physicochemical ( , electro-coagulation process for arsenic and nitrogen removal (Kumar and Goel 2010) and biological processes ( , anaerobic treatment (Hong et al. 2009)) in water treatment and other applications ( , biohydrogen production from pig slurry (Kotsopoulos et al. 2009)). The mode of operation of reactors may be batch flow or Continuous flow. In a batch flow reactor, the reactor is charge with reactant, the content are well mixed and left to react and then the mixture will be discharged.)
3 In the other hand, a Continuous flow reactor, the feed to reactor and the discharge from it are Continuous . The three types of Continuous flow reactor are plug flow reactor, the dispersed plug flow reactor, and completely mixed or continuously Stirred tank reactors (CSTRs). CSTR consists of a Stirred tank that has a feed stream and discharge stream. Frequently, several CSTRs in series are employ to improve their conversion and performance (Reynolds and Richards 1996). In different applications of CSTRs, the performance can be monitored by Tracer Studies . In water treatment, the most common Tracer Studies are pulse input and step input. Both Tracer Studies give two-dimensional plots called Tracer curves. These are concentration versus time graphs, which can be compared with those suggested by models and standard equations. Upon comparing the predicted and the actual graphs, the efficiency of reactor or a series of reactors can be estimated (Teefy 1996).
4 In case of pulse input (also called slug dose), a known mass of Tracer chemical is added immediately upstream of the reactor inlet. Theoretically, all the mass is added in an infinitesimally small time. In step input tests a constant dose of the Tracer chemical is maintained immediately upstream of the reactor for the duration of the experiment. Each of the two tests, pulse and step input, has some advantages and disadvantages. For example, the amount of Tracer chemical required will be more in case of step input as compared to pulse input. This is especially important where costly Tracer chemicals are used for these tests. The Tracer curves obtained by pulse input require more rigorous mathematical manipulation to determine the value of t10. (t10 refers to the time at which 10% of Tracer has passed through the effluent outlet to next reactor.)
5 Step input yields graphs that can readily yield t10 values. Mean residence time and mass recovery rates are easier to obtain from pulse input tests than step input tests. Also, step input tests might require additional metering pumps for the experiment (Teefy 1996). The choice of the Tracer chemical is also an important consideration in these Tracer Studies . As no Tracer is ideal for all situations, the choice needs to be made on a case-by-case basis. For drinking water treatments plants, the Tracer must be non-toxic and adhere to the regulations and standards applicable to the water treatment facility. The cost of the Tracer chemical must also be taken into consideration for regular use in any water treatment plant. Materials & Method: All experiments for pulse and step input were conducted using in a six-CSTRs-in- series system .
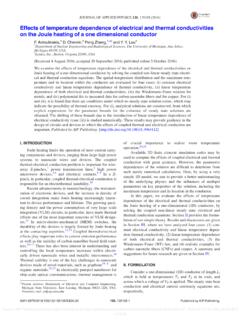
6 The volume of each reactor was calculated to be 1620 mL. The six reactor tanks made from polyvinyl chloride (PVC) were rectangular in shape and connected by overflow the baffle, with each tank being Stirred by an agitator (Model 7790-400, Philips & Bird Inc., Richmond, VA). Figure 1 shows a schematic of the reactor setup. Sodium chloride was used as the non-reactive Tracer . Four conductivity probes were used to measure the conductivity in reactors 1,2,4 and 5. Figure 1 A calibration curve for each probe was prepared using standard solutions of sodium chloride (100 mg/L, 500 mg/L, 750 mg/L, 1000 mg/L and 1500 mg/L) (Columbus Chemical Industries, Inc, ACS grades). The experiments for pulse input and step input were run in triplicate. Initial setup: The reactors were filled with deionized (DI) water and the inflow (from the DI water tap) and the outflow from the sixth reactors were adjusted to achieve a steady flow.
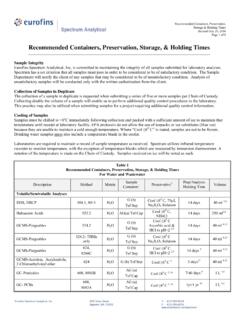
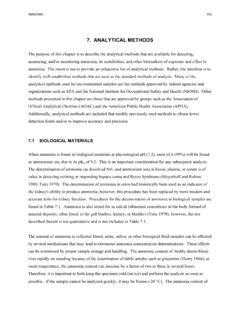
7 The stirrers were set at 100 rotations per minute (rpm). The conductivity meters were securely placed in reactors 1, 2, 4 and 5 and real time readings were taken for two minutes to ensure that the system was running smoothly. Pulse input: Run 1: 1620 mg of sodium chloride was mixed in 10 mL of DI water and added to the first reactor. The flow rate of DI water was mL/s. The real time readings were recorded for 5400 seconds at a sampling rate of one reading per second. Runs 2 and 3: 1620 mg of sodium chloride was mixed in 25 mL of DI water and added to the first reactor. The flow rate of DI water was mL/s. The real time readings were recorded for 4500 seconds at the rate of one reading per second. (The run time was reduced from 5400 seconds to 4500 seconds because the initial run time was found to be unnecessarily long.) Figure 2: Setup for Pulse input Step input: The flow rate of DI water was maintained at ml/s for Run 1 and mL/s for Runs 2 and 3.
8 A 10000 mg/L solution of sodium chloride was passed through the setup. The flow rate of the solution set at mL/s using a peristaltic pump (Vera Veristaltic Pump Plus, Manostat Corporation). The real time readings were recorded for 5400 seconds at a sampling rate of one reading per second. Figure 3: Setup for Step input with peristaltic pump The real time reading from the conductivity probes were recorded in a computer via LabPro interface (Vernier) using Logger Pro software (Vernier). Two models were made using MATLAB (R2008b, The MathWorks, Inc.,) (Hahn and Valentine 2007) to simulate the experimental conditions for pulse and step inputs. Results: The variation of concentration in different reactors matched the trend suggested by the model. However, there were differences in the values for peak concentration and the time at which the peaks occurred.
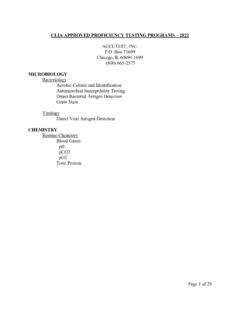
9 Comparison of the actual experimental results with theoretical models: Pulse input: The peak values of concentration in the experimental findings were less than those suggested by the theoretical models. Also, the peaks occur earlier in the experimental findings as compared to the models. The slopes of the concentration curves in the experiments were steeper than those in the models. Figures 4-6 show a concentration curves from the models and the experiments with pulse input. (The possible reasons for these are discussed under Discussion and Analysis .) Figure 4: Pulse input Run 1 Figure 5: Pulse input Run 2 Figure 6: Pulse input Run 3 Step input: The saturated values of concentration from the experiments were lower than those suggested by the theoretical models (with the exception of Run 3).
10 The saturated concentration value for Run 1 differed from those in the model by more than 50%. The slopes of the concentration plots from the experiments were steeper than those predicted by the models. This also means that the concentrations reached the saturated values earlier than expected from the models. Figures 7-9 show the variation of concentration in the models and the experiments. For Run 1, it was observed that the concentrations reduced very gradually after reaching the saturated value. (Please refer to the section Discussion and Analysis for further explanation of the results.) Figure 7: Step input Run 1 Figure 8: Step input Run 2 Figure 9: Step input Run 3 Discussion and Analysis: Explanation for the early occurrence of peaks and saturated values of concentration: For pulse input, the concentration in the ith reactor in series is given by: where tR = retention time = (Volume of the reactor) (Flow rate of DI water) Ci = concentration in Reactor i at time t C0 = Concentration of the pulse input Ci=C0ttR (i 1)(i 1)!