Transcription of TRACK BIAS EXPLANATION - brisnet.com
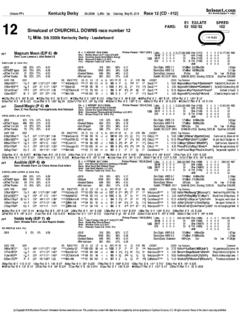
1 TRACK BIAS EXPLANATION . 1) Surface, Distance, and # of Races: Provides information on the total number of races run at today's distance and surface. If there is an insufficient number of races in the database for the exact distance of today's race, the distance category (sprint or route) will be displayed instead. 2) % Wire: Provides information on the percentage of races won in wire-to-wire fashion at this distance and surface. 3) Speed Bias: The percentage of races won by horses exhibiting either an E or E/P running style. 4) Date Range: The date range of the statistics included. 5) WnrAvgBl: The eventual winner's average beaten lengths at the 1stCall (first call) of the race and the 2ndCall (second call). of the race. 6) Runstyle: a) E (Early) = A horse that exhibits this run style is one typically vies for the early lead or whose best races are run on the lead. Most horses in this category to not successfully rate behind a pace setter.
2 B) E/P (Early/Presser) = A horse that exhibits this run style is one that runs second or third within a few lengths of the lead early before trying to run down the leader. An E/P horse, just like an E horse, may run on the front end but, unlike an E horse, it can be expected to successfully rate behind a pace setter. c) P (Presser) = A horse that exhibits this run style is one that runs in the middle-of-the-pack early before trying to run down the leader. A P horse may at times run close to the lead but rarely, if ever, challenges for the lead early. Unlike and S horse, the P horse doesn't typically run from the rear of the pack in its better races. d) S (Sustain or Closer) = A horse that exhibits this run style is one that runs in the back of the pack early before trying to run down the leader. e) NA (Not Available) = A horse that is a first time starter or who hasn't had enough meaningful running lines to accurately assess the horse's preferred run style.
3 7) Impact Value: The BRIS Impact Value mathematically represents the effectiveness of a Running Style or Post Position at a specific TRACK /distance. The average Impact Value of all starts is and the higher the number, the better. a) Example #1: Impact Value: means that the run style or post position won only its rightful share of races or only 50% of the expected number of wins. b) Example #2: Impact Value means that the run style or post position won 1 times its rightful share of races or won 150% of the expected number of wins. Note: The average Impact Value of all Run Styles and Post Positions may not equal due to the fact that each Run Style/Post Position category may not have the same number of starts. 8) % Races Won: Provided for each Running Style, this represents the percentage of races won by each run style. 9) Post Bias: a) RAIL: Post Position #1. b) 1-3: Post Positions #1, #2, #3.
4 C) 4-7: Post Positions #4, #5, #6, #7. d) 8+: Post Positions #8, #9, #10, #11, #12, etc. 10) Avg Win %: The average win percentage for the pertinent post position category. Note: The win percentage will not total 100% because the stats given are averages of post position groups. 11) TRACK Bias Symbols: a) + = A favorable post position/run style for this TRACK /distance which is relative to the other post positions/running styles. Displayed above the Impact Value when appropriate, the single plus (+) provides a quick and easy means to identify a favorable post position/run style based on Impact Value or percentage of races won. b) ++ = The best or most successful run style for this TRACK /distance. Displayed above the Impact Value when appropriate, the double plus (++) provides a quick and easy means to identify the dominant/most successful run style based on Impact Value and percentage of races won.
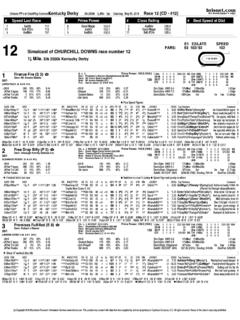
5 ultimate RACE SUMMARY EXPLANATION . NOTE: Horses are ranked in the Race Summary by their Avg Dist/Surf speed rating. If this area is blank, then the order of ranking is random. 1) Horse Information: Provides information on: a) # -- The program number of the horse b) Horse Name The name of the horse c) ML Odds The morning line odds for the horse established by the race TRACK . d) Med/Eqp The medication and/or equipment the horse will be using today. L = Lasix, b = blinkers e) Days Since L/R Days Since Last Race. One dot after this stat indicates that his last race was the horse's first start off of a layoff. Two dots indicate that his last race was the horse's second start off of a layoff. 2) Run Style & PTS: Provides information on: a) The run style of the horse. E = Early, E/P = Early/Presser, P = Presser, S = Sustained or closer. For more information on run styles, refer to the ultimate PP EXPLANATION or the TRACK BIAS.
6 EXPLANATION . b) PTS or Early Speed Points. The numbers range from 0-8 and measure the Early Speed ability of the horse based on its running position and beaten lengths at the first call of recent races. The higher the number, the more early speed a horse has shown in recent races. NOTE: A + (plus sign) indicates that this is a favorable running style for this race. A ++ (double plus sign) indicates that this is the best or most dominant running style for this race. For more information on the + and ++, please refer to the TRACK BIAS EXPLANATION . 3) Avg Dist/Surf: Average speed and pace ratings for the horse specific to today's distance and surface category. a) E1 The average pace rating for the horse from the start to the first call of the race for today's distance and surface category. b) E2 The average pace rating for the horse from the start to the second call of the race for today's distance and surface category.
7 C) Late The average pace rating for the horse from the second call of the race to the finish for today's distance and surface category. d) SPD The average BRIS speed rating for the horse at today's distance and surface category. NOTE: Speed ratings surrounded by asterisks indicate that two or more races occurred at or near today's distance and surface within the last 90 days and are included in the average. Parentheses indicate that the race used occurred more than 90 days ago. If there are no asterisks or parentheses, there was only one race in the last 90 days at or near today's distance and surface category and the pace and speed ratings are for that race. 4) Avg Race Rtng: An average of a horse's most recent Bris Race Ratings at today's distance/surface category. Bris Race Ratings measures how strong a field was not on the race classification but on the actual horses that raced. The higher the number is, the better the quality of the field the horse faced.
8 For more information please refer to the BRIS CLASS AND. RACE RATING FAQ found in the Library of the Brisnet web site. 5) Best Pace: The best E1 pace figure, best E2 pace figure, and best LP pace figure earned by the horse for today's distance and surface category within a one year period. For more information on pace figures, please refer to the ultimate PAST. PERFORMANCE EXPLANATION . 6) Final Speed: The Final Speed shows the horse's final speed figure for the last four races back, starting with the most recent. Any speed ratings earned at today's distance/surface category will have a dot after the rating. Turf races are indicated with a T . 7) ACL: The Average Competitive Level is a rating based on the Race Ratings when finishing in the money. Parentheses indicate a rating that was not at today's distance and surface. For a detailed EXPLANATION of the ACL, please refer to the AVERAGE COMPETITIVE LEVEL article found in the Library of the Brisnet web site.
9 8) Rcg Spd Avg: Racing Speed Average is an average of the speed ratings earned by a horse over the course of its last three starts. 9) Previous Race Ratings: This is the race rating for the horse's three previous races. R1 is the first race back, R2 is the second race back, and R3 is the third race back. 10) Mud Spd: The best BRIS speed rating a horse has earned over a muddy/sloppy TRACK . 11) Pedigree Statistics: Provides Information on: a) Mud Sts This is the number of all starts that progeny of the sire have made on off tracks. (This statistic is shown on all races except for two-year-old, maiden, and turf races.). b) % Mud This is the percentage of wins from starts that the sire's progeny have over off tracks. c) % 1st This is the percentage of the sire's progeny that win when making their first career start. (This statistic is shown on two-year-old and maiden races only.). d) SPI The Sire Production Index compares the earnings of this sire's offspring with the average earnings of the offspring of all North American sires.
10 The average is established at so if a sire's spi is this means that his offspring's average earnings are twice the national average. (This statistic appears on two-year-old and maiden races only). e) DPI The Dam Production Index compares the earnings of this dam's produce with the average earnings of the produce of all North American broodmares. The average is established as so if a dam's dpi is this means that her produce average earnings are twice the national average. (This statistic appears on two-year-old and maiden races only). f) %Trf This is the percentage of wins from starts the sire's progeny have on the turf. (This statistic appears on turf races only.). g) Sire AWD The average winning distance of the sire's offspring represented in furlongs. h) Dam Sire's AWD The average winning distance of the sire's offspring represented in furlongs. Speed Last Race: The speed figure earned by each horse in their last start, regardless of distance or surface.


