Transcription of TRAFFIC STREAM CHARACTERISTICS
1 TRAFFIC STREAM CHARACTERISTICSBY FRED L. HALL 4 Professor, McMaster University, Department of Civil Engineering and Department of Geography, 1280 Main Street West,4 Hamilton, Ontario, Canada L8S 2 - Frequently used Symbolskdensity of a TRAFFIC STREAM in a specified length of roadLlength of vehicles of uniform lengthcconstant of proportionality between occupancy andkdensity, under certain simplifying assumptionskthe (average) density of vehicles in substream Iiqthe average rate of flow of vehicles in substream Ii average speed of a set of vehiclesAA(x,t)
2 The cumulative vehicle arrival function overspace and timekjam density, the density when TRAFFIC is so heavy thatjit is at a complete standstillufree-flow speed, the speed when there are nofconstraints placed on a driver by other vehicles on theroad STREAM CHARACTERISTICSThis chapter describes the various models that have beendevelopments in measurement procedures. That section isdeveloped to describe the relationships among TRAFFIC streamfollowed by one providing detailed descriptions and definitionscharacteristics.
3 Most of the work dealing with these relationshipsof the variables of interest. Some of the relationships betweenhas been concerned with uninterrupted TRAFFIC flow, primarily onthe variables are simply a matter of definition. An example is thefreeways or expressways. Consequently, this chapter will coverrelationship between density of vehicles on the road, in vehiclestraffic STREAM CHARACTERISTICS for uninterrupted flow. Inper unit distance, and spacing between vehicles, in distance perdiscussing the models, the link between theory and measurementvehicle.
4 Others are more difficult to specify. The final section, oncapability is important since often theory depends ontraffic STREAM models, focuses on relationships among speed,measurement capability. flow, and concentration, either in two-variable models, or inBecause of the importance of measurement capability to theoryvariables. development, this chapter starts with a section on historicalthose that attempt to deal simultaneously with the Measurement ProceduresThe items of interest in TRAFFIC theory have been the following: measurement over a length of road [usually at least rates of flow (vehicles per unit time); the use of an observer moving in the TRAFFIC STREAM ; and speeds (distance per unit time).]
5 Wide-area samples obtained simultaneously from a number travel time over a known length of road (or sometimes theof vehicles, as part of Intelligent Transportation Systemsinverse of speed, tardity is used);(ITS). occupancy (percent of time a point on the road is occupiedby vehicles);For each method, this section contains an identification of the density (vehicles per unit distance);variables that the particular procedure measures, as contrasted time headway between vehicles (time per vehicle); with the variables that can only be estimated.
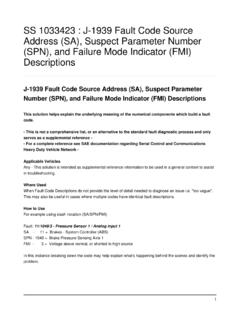
6 Spacing, or space headway between vehicles (distance pervehicle); andThe types of measurement are illustrated with respect to a space- concentration (measured by density or occupancy).time diagram in Figure The vertical axis of this diagramA general notion of these variables, based on the intuitive idearoad, in the direction of travel. The horizontal axis representsself-evident from their names, will suffice for the purposes ofelapsed time from some arbitrary starting time. Each line withindiscussing their measurement.
7 Precise definitions of thesethe graph represents the 'trajectory' of an individual vehicle, asvariables are given in Section it moves down the road over time. The slope of the line is thatMeasurement capabilities for obtaining TRAFFIC data have changedovertaken and passed a slower one. (The two vehicles do not inover the nearly 60-year span of interest in TRAFFIC flow, and morefact occupy the same point at the same time.) Measurement atso in the past 40 years during which there have been a largea point is represented by a horizontal line across the vehicularnumber of freeways.
8 Indeed, measurement capabilities are stilltrajectories: the location is constant, but time Five measurement procedures are discussed in thisMeasurement over a short section is represented by two parallelsection: horizontal lines a very short distance apart. A vertical line measurement at a point; time, such as in a single snapshot taken from above the road (for measurement over a short section (by which is meant lessexample an aerial photograph). The moving observer techniquethan about 10 meters (m);is represented by one of the vehicle trajectories, the heavy line inkilometers (km)]; represents distance from some arbitrary starting point along thevehicle's velocity.)
9 Where lines cross, a faster vehicle hasrepresents measurement along a length of road, at one instant of 75$)),&675($0&+$5$&7(5,67,&6 Figure Methods of Obtaining TRAFFIC Data (Modified from Drew 1968, Figure ).Figure Details on each of these methods can be found in theOne of the more recent data collection methods draws uponITE's Manual of TRAFFIC Engineering Studies (Box 1976). video camera technology. In its earliest applications, videoThe wide-area samples from ITS are similar to having a numberthen subsequently played back in a lab for analysis.
10 In these earlyof moving observers at various points and times within theimplementations, lines were drawn on the video monitor screensystem. These new developments will undoubtedly change the(literally, when manual data reduction was used). More recentlyway some TRAFFIC measurements are obtained in the future, butthis has been automated, and the lines are simply a part of thethey have not been in operation long enough to have a majorelectronics. This procedure allows the data reduction to beeffect on the material to be covered in this simultaneously with the data acquisition.