Transcription of Transport Statistics Great Britain 2020 - GOV.UK
1 Statistical Release 17 December 2020 Transport Statistics Great Britain 202085% of visits overseas were by air. Air visits increased by 57% in 10 yearsAverage time taken to travel to work in 2019 was 30 minutes across all were million visitsoverseas by UK residents in made an average of953 tripsacross private and public Transport in 2019, 580 in cars/ air passengers and 31% of sea passengers travelled billion passenger kilometres were travelled in Britain in 2019, an increase of 11% from billion tonne kilometres of domestic freight was moved within the UK.
2 Up 1% from remains the largest emitting sector of domestic greenhouse gases in domestic freight was moved by international freight arriving in the UK came by Transport produced 124 million tonnesof CO2equivalentin 2018, a decrease of 3% since now accounts for 50% of UK domestic nitrogen oxide this releaseThis release presents a summary of Transport Statistics , the majority of which relate to calendar year 2019. The 2020 release includes a condensed set of highlights, which is complemented by other DfT releases presenting more detailed and more recent Statistics .
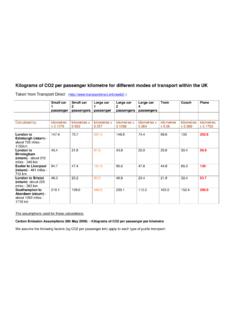
3 COVID-19 and Transport statisticsSome of the Statistics in this release cover the financial year of 2019/20 and therefore include data for the beginning of the coronavirus (COVID-19) pandemic, but the majority do not. Transport trends will have been affected by the restrictions throughout 2020, so care must be taken in comparing Statistics in this release with current travel behaviours. Statistics on Transport use during the coronavirus pandemic can be found on Transport p2 Freight Transport p5 Environment p6 LEAD STATISTICIAN:Lisa Eyers 020 7944 4847 Page 020 7944 4847 2 Transport Statistics Great Britain 2020 passenger TransportHow much we travel In 2019, 873 billion passenger kilometres were travelled in Great Britain , with 84% of passenger kilometres made by cars, vans and taxis.
4 There were million passenger journeys on public Transport vehicles in 2019/20, a decrease of 4% on previous billion journeys by rail* 81% on billion journeys on local bus services 63% on 1960*Rail includes trips by National Rail, London Underground, and Glasgow , TSGB0102 passenger kilometres by mode, Great Britain ,1960-201901002003004005006007008 009001,000196019701980199020002010 OtherRailBuses & CoachesCars, vans & taxisbillionpassenger-kmsHow many trips we make On average people made 953 trips using a combination of different modes in 2019, a fall of 4% when compared to number of trips made per person, England, 2019*Rail includes trips by surface rail (National Rail)
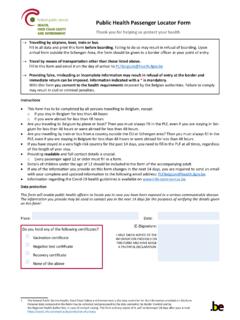
5 And London Underground** Other public trans-port includes trip by air, ferries and light railOther private transport9 tripsWalk250 tripsBicycle16 tripsCar/van580 tripsOther public transport3 tripsTaxi/minicab11 tripsBus50 tripsRail33 tripsPrivatetransport855 tripsPublictransport97 tripsTSGB0103 How much we travel on public transportPassenger journeys by mode: Great Britain 1985/86 to 2019/20 Billion0123451985/861990/911994/951998/9 92002/032006/072010/112014/152019/20 Buses(London)Buses (GB outside London)National Rail Underground (London and Glasgow)Light Rail and TramLatest year (2019/20)
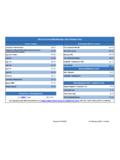
6 Contains some of the coronavirus national lockdown period, which has affected 2019/20 billion local bus passenger journeys in Great Britain , 57% of all public Transport billion National Rail passenger journeys in Great Britain , an increase of 154% since 1985 billion passenger journeys on light rail and tram systems in Great Britain , a slight decrease on the previous TransportWhy we travel Around a quarter (26%) of all trips were for leisure purposes in 2019, that includes trips to visit friends, sports, holidays and day trips.
7 Around 18% of trips were for commuting or business purposes. Most modes of travel are used for a mixture of purposes, however over half (57%) of all trips by rail are for either commuting or business by purpose and main mode, England, 20190%20%40%60%80%100%CommutingBusinessE ducation / escort educationShoppingOther escortPersonal businessLeisureOther including just walkAll purposesWalkBicycleCar/vanOther private transportBusRailTaxi/minicabOther public transportTSGB0104 How we commute Across Great Britain , 68% of workers typically travelled to work by car.
8 Though this varied by region with London having a substantially lower proportion of people commuting by car (27%). The average time taken to travel to work in 2019 was 30 minutes, ranging from an average of 14 minutes for walking to 58 minutes for travelling by 11%Walk 9%Bus 7%Other 4%Usual method of travel to work, Great Britain , 2019*Rail includes travel by National Rail, underground and light railway systems and of workers usually travelling to work by car by region of workplace, Great Britain , 201976%77%74%80%79%79%77%75%27%80%70%TSG B01124 passenger TransportHow we travel overseas There were million visits overseas by UK residents in 2019, an increase of 3% compared to 2018.
9 Million visits were made by overseas residents to the UK in 2019, 1% more than in 2018. The most frequent reason for travel overseas was for holidays (63%).Visits abroad by UK residents, (85%) (8%) (7%)AirSeaChannel TunnelSource: International passenger SurveyVisits to the UK by overseas residents, (75%) (11%) (10%)AirSeaChannel TunnelSource: International passenger SurveyOffice for National Statistics (ONS) have introduced a methodological change in 2020, which means the data series back to 2009 were revised. Comparisons with previous TSGBs should not be made, for more details please see International passenger Survey Travel Trends: TSGB0115 International passenger movements In 2019 there were million sea passengers.
10 31% travelled internationally by sea. This excludes cruise passengers. UK airports handled 297 million terminal passengers in 2019, of which 87% were international passenger movements. This excludes air travel to oil rigs. 72% of international ferry passengers travelled between France and the UK, with the rest of international ferry passengers travelling on routes between Europe and the UK. million passengers travelled to/ from Europe using the Channel Tunnel 72% of international passenger movements at airports were to/from Europe, with 27% flying to the rest of the world.