Transcription of Trends in international arms transfers, 2020
1 The volume of international transfers of major arms in 2016 20 was per cent lower than in 2011 15 and 12 per cent higher than in 2006 10 (see figure 1).1 The five largest arms exporters in 2016 20 were the United States, Russia, France, Germany and China (see table 1). The five largest arms importers were Saudi Arabia, india , Egypt, Australia and China (see table 2). Between 2011 15 and 2016 20 there were increases in arms transfers to the Middle East (25 per cent) and to Europe (12 per cent), while there were decreases in the transfers to Africa ( 13 per cent), the Americas ( 43 per cent), and Asia and Oceania ( per cent).From 15 March 2021 SIPRI s open-access arms Transfers Database includes updated data on transfers of major arms for 1950 2020, which replaces all previous data on arms transfers published by SIPRI. Based on the new data, this Fact Sheet presents global Trends in arms exports and arms imports, and highlights selected issues related to transfers of major arms (see box 1).
2 KEY FACTSw The volume of international transfers of major arms in 2016 20 was per cent lower than in 2011 15 and 12 per cent higher than in 2006 The five largest arms exporters in 2016 20 were the United States, Russia, France, Germany and China. Together, they accounted for 76 per cent of all exports of major arms in 2016 I n 2016 20 US arms exports accounted for 37 per cent of the global total and were 15 per cent higher than in 2011 15. w Russian arms exports decreased by 22 per cent between 2011 15 and 2016 Between 2011 15 and 2016 20 arms exports by France and Germany increased by 44 and 21 per cent, respectively, whereas those of China decreased by 7. 8 per cent .w The five largest arms importers in 2016 20, Saudi Arabia, india , Egypt, Australia and China, together received 36 per cent of all imports of major The main recipient region in 2016 20 was Asia and Oceania (accounting for 42 per cent of global arms imports), followed by the Middle East (33 per cent), Europe (12 per cent), Africa ( per cent) and the Americas ( per cent).
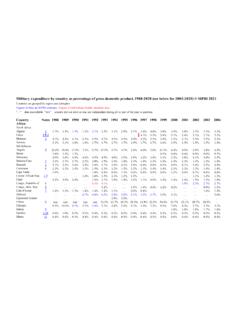
3 Trends IN international arms TRANSFERS, 2020pieter d. wezeman, alexandra kuimova and siemon t. wezemanMarch 2021 SIPRI Fact SheetFigure 1. The trend in international transfers of major arms , 1981 2020 Note: The bar graph shows the average volume of arms transfers for 5-year periods and the line graph shows the annual totals. The SIPRI trend-indicator value (TIV) is a measure of the volume of inter national transfers of major arms . The method used for the SIPRI TIV is described on the arms Transfers Database web : SIPRI arms Transfers Database, Mar. of arms transfers (billions of trend-indicator values)010203040501981 851986 901991 951996 20002001 20052006 102011 152016 201 I n this Fact Sheet the terms arms exports and arms imports are used to refer to international transfers of major arms , as defined by sipri fact sheetTHE EXPORTERS, 2016 20 SIPRI has identified 65 states as exporters of major arms in 2016 20. The five largest suppliers of arms during that period the USA, Russia, France, Ger-many and China accounted for 76 per cent of all arms exports (see figure 2 and table 1).
4 France had the highest increase in arms exports among the top five. US and German arms exports also grew, while Russian and Chinese arms exports decreased (see figure 3). The top 25 arms exporters accounted for 99 per cent of global exports of major arms in 2016 20 (see table 1). States in North America and Europe together accounted for 86 per cent of all arms United StatesUS arms exports grew by 15 per cent between 2011 15 and 2016 20, increas-ing its global share from 32 to 37 per cent. The USA delivered major arms to Table 1. The 25 largest exporters of major arms and their main recipients, 2016 20 Note: Percentages below 10 are rounded to 1 decimal place; percentages over 10 are rounded to whole of arms exports (%)Per cent change from2011 15 to2016 20aMain recipients (share of exporter s total exports, %), 2016 201st 2nd 3rd2016 202011 151 United States373215 Saudi Arabia (24)Australia ( )South Korea ( )2 Russia2026-22 india (23)China (18)Algeria (15) (21)Egypt (20)Qatar (18) Korea (24)Algeria (10)Egypt ( ) (38)Bangladesh (17)Algeria ( )6 United Arabia (32)Oman (17)USA (14) (33)Singapore (13)Turkey ( ) (43)Azerbaijan (17)Viet Nam (12)9 South (14)Philippines (12)Thailand (11) (18)Egypt (17)Pakistan ( ) (17)USA (15)Mexico (10) (36)Russia (20)Thailand (17) (19)Turkmenistan (19)Malaysia (11) (23)China (13)Denmark ( ) (25)Pakistan (11)Algeria (11) (31)USA (27)Canada (20) Arabia (49)UA E (17)Australia ( )18UA (34)Jordan (21)Algeria (14) Nam (26)Serbia (16)Sudan (13) (26)France (21)Chile (10) (47)USA (17)Poland (13)22 South (24)
5 UA E (17) india (13) (29)USA (22)Ukraine (14) (52)Sri Lanka (24)Mauritius (13) < (98)Cabo Verde ( )Colombia ( )UAE = United arab Figures show the change in volume of the total arms exports per exporter between the 2 : SIPRI arms Transfers Database, Mar. in international arms transfers, 2020 396 states in 2016 20, a far higher number of recipients than any other supplier. In 2016 20 total arms exports by the USA were 85 per cent higher than those of Russia the second largest exporter compared with 24 per cent higher in 2011 15. Almost half (47 per cent) of US arms exports went to the Middle East in 2016 20, an increase of 28 per cent on the previous five-year period. There were particularly large increases in US arms exports to three countries in the region between 2011 15 and 2016 20: Israel (335 per cent), Qatar (208 per cent) and Saudi Arabia (175 per cent).
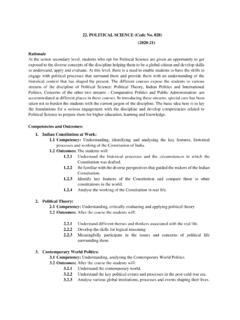
6 Saudi Arabia was the main recipient of US arms transfers in 2016 20, accounting for 24 per cent of US arms exports. Qatar and Israel were the sixth and seventh largest importers of US arms were notable decreases in US arms exports to the United arab Emirates (UAE) and to Turkey between 2011 15 and 2016 20. US arms exports to the UAE fell by 36 per cent, making it the fifth largest recipient of US arms in 2016 20. The 81 per cent decrease in US arms transfers to Turkey meant that it dropped from being the 3rd largest recipient of US arms exports in 2011 15 to the 19th largest in 2016 20. In 2019 the USA halted deliveries of combat aircraft to Turkey after Turkey imported air defence systems from Russia. Had the USA not suspended the contract, the fall in US arms exports to Turkey would not have been as in Asia and Oceania received 32 per cent of total US arms exports in 2016 20, compared with 34 per cent in 2011 15. Amid the intensifying rivalry between the USA and China, three US allies in the region were among the five largest importers of US arms in 2016 20: Australia accounted Figure 2.
7 Global share of major arms exports by the 10 largest exporters, 2016 20 Source: SIPRI arms Transfers Database, Mar. 1. The drop in arms transfers in 2020 Significant year-on-year fluctuations in volumes of international transfers of major arms are common. Therefore, SIPRI pre-sents data for five-year periods, giving a more stable measure of Trends . However, the value of global arms transfers in 2020 was exceptionally low 16 per cent lower than in 2019 and 20 per cent below the annual average in 2011 19. This might be partly due to the Covid-19 pandemic which disrupted some arms companies planned production and delivery schedules and the related economic crisis. However, the drop in arms transfers in 2020 was also related to other supply- and demand-side factors, including national procurement cycles, gaps in deliveries during shifting relations between suppliers and recipients, and non-pandemic-related economic conditions. The uncertainty about whether the pandemic was a major cause for the fall in arms transfers in 2020 is highlighted, for instance, by the fact that several states actually had higher levels of arms deliveries in 2020 than in some other years in the period 2011 19.
8 For example, US arms exports in 2020 were higher than they were in three years in 2011 19 and French arms exports in 2020 were higher than in five years in the same period. Similarly, on the recipient side, arms deliveries to Australia in 2020 were higher than in any year in 2011 States 37%Russia20%4 sipri fact sheetfor per cent of US arms exports, South Korea for per cent and Japan for per in Europe received 15 per cent of total US arms exports in 2016 20. This was an increase of 79 per cent on 2011 15, which was mainly due to deliveries of combat aircraft that were ordered in 2006 12. US arms exports to Africa increased by per cent between 2011 15 and 2016 20, while those to the Americas decreased by 48 per 2016 20 Russia delivered major arms to 45 states and accounted for 20 per cent of total global arms exports. india remained the main recipient of Russian arms in 2016 20, accounting for 23 per cent of the total, followed by China (18 per cent) and Algeria (15 per cent).
9 Russian arms exports in 2016 20 were at a similar level to 2001 2005 and 2006 10 but were 22 per cent lower than in 2011 15, when Russian arms exports peaked. While Russian arms exports in 2016 18 remained at a relatively high level, they fell in both 2019 and 2020. The overall decrease in Russia s arms exports between 2011 15 and 2016 20 was almost entirely attributable to a 53 per cent drop in its arms exports to india . This decrease was not offset by large increases in Russia s arms exports to China (49 per cent), Algeria (49 per cent) and Egypt (430 per cent). Although several large Russian arms deals with india , including for combat aircraft, were completed by 2020, india placed new orders for a variety of Russian arms in 2019 20. The ensuing deliveries will probably lead to an increase in Russian arms exports in the coming five the regional level, states in Asia and Oceania accounted for 55 per cent of Russian arms exports in 2016 20, the Middle East for 21 per cent and Africa for 18 per cent.
10 Between 2016 20 and 2011 15 Russian arms exports to Asia and Oceania fell ( 36 per cent), while those to the Middle East (64 per cent) and Africa (23 per cent) increased. Aircraft accounted for 49 per cent of Russian arms exports in 2016 20. These transfers included deliveries of a total of 231 combat European Union and West European countriesThe combined arms exports of European Union (EU) member states accounted for 26 per cent of the global total in 2016 20, the same percentage as in 2011 15. The top five West European arms exporters France, Germany, the United Kingdom, Spain and Italy together accounted for 22 per cent of global arms exports in 2016 20 (see figure 2), compared with 21 per cent in 2011 15. French arms exports accounted for per cent of the global total after increasing by 44 per cent between 2011 15 and 2016 20. At the regional level, the Middle East accounted for 48 per cent of French arms exports in 2016 20 while Asia and Oceania accounted for 36 per cent.