Transcription of TRIC SET FCTS
1 NHTSA s Office of Behavioral Safety Research 1200 New Jersey Avenue SE, Washington, DC 20590 TRAFFIC SAFETY FACTSR esearch NoteBehavioral Safety ResearchDOT HS 813 210 October 2021 Continuation of Research on Traffic Safety During the COVID-19 Public Health Emergency: January June 2021 The National Highway Traffic Safety Administration continues to explore traffic safety during the COVID-19 public health emergency. This work is crucial to further understanding changes in dangerous driving behav-iors and letting us expand or evolve countermeasures to meet current needs in States and across the country. This Research Note updates traffic safety behavioral research findings during the COVID-19 public health emergency through the first half of the 2021 calendar year. To date, NHTSA has released three reports synthesiz-ing traffic safety data in 2020.
2 NHTSA also released an interim report on research examining the presence of drugs and alcohol in road users who were seriously and fatally injured in crashes, which noted increased preva-lence of alcohol and some other drugs among these individuals. These reports provided context to prelim-inary 2020 data that showed increases in the number and rate of fatalities per 100 million vehicle miles trav-eled (VMT) (National Center for Statistics and Analysis, 2021a). Given the importance of these findings, NHTSA immediately convened workshops and meetings with national partners, State highway safety professionals, and researchers. In these meetings, NHTSA led con-versation on how to address these increases in traffic fatalities, especially focusing on risky driving behav-iors.
3 NHTSA continued to collect and synthesize data. New findings are described below. Data limitations identified in the earlier reports also apply to the data reported the declaration of the public health emergency in March 2020, driving patterns and behaviors in the United States changed significantly (Wagner et al., 2020; Office of Behavioral Safety Research, 2021a, 2021b). Of the drivers who remained on the roads, some engaged in riskier behavior, including speeding, failure to wear seat belts, and driving under the influence of alcohol or other drugs. Traffic data cited in those reports showed average speeds increased during the last three quarters of 2020, and extreme speeds, those 20 miles per hour (or more) higher than the posted speed limit, became more common.
4 These findings were supported by analyses of data from fatal crashes that show an estimated 11% increase in speeding-related fatalities (NCSA, 2021b). Other data suggested fewer people in crashes used their seat belts. Earlier research reports showed changes in the prevalence of alcohol and other drugs during the pandemic among seriously or fatally injured road users at different phases of the pandemic (Thomas et al., 2020, Office of Behavioral Safety Research, 2021a, 2021b). For example, the Thomas group found that almost two-thirds of the seriously or fatally injured drivers in their study tested positive for at least one active drug, includ-ing alcohol, marijuana, or opioids between mid-March and mid-July 2020. They also reported the proportion of drivers testing positive for opioids nearly doubled after mid-March 2020, compared to the previous 6 months, while marijuana prevalence increased by about 50%.
5 This Research Note includes analyses from the Bureau of Transportation Statistics (BTS) and the Federal Highway Administration s (FHWA) National Performance Management Research Dataset (NPMRDS). These sources use telematic data that captures large volumes of information but does not permit analysis of individ-ual performance. To address this limitation, researchers sought other data sources through traditional literature as well as gray literature such as blog posts to iden-tify potential emerging behavioral safety trends that occurred during the public health emergency. They identified research reports documenting changes in distracted driving and other risky driving behaviors, 2 NHTSA s Of ce of Behavioral Safety Research 1200 New Jersey Avenue SE, Washington, DC 20590the findings of which are described later in this report.
6 Data from the National Emergency Medical Services Information System (NEMSIS) are also included in this Research Note. NEMSIS data are derived from responding emergency medical services (EMS) agen-cies in States and Territories. While the database does not contain every EMS dispatch, it does include mil-lions of motor vehicle crash-related cases every year. Tr avel Pat ternsResearchers using the BTS (2021) interactive data dash-board on travel (see ) deter-mined that in 2019 and early 2020 (before the pandemic) around 19% of the national population stayed home on any given day. During the post-public health emer-gency portion of 2020 (March-December) that percentage shifted to around 25%. Since the beginning of 2021, the percentage of people staying home per day has dropped from a high of 26% in January to approximately 23% in May and June.
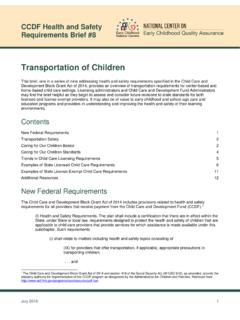
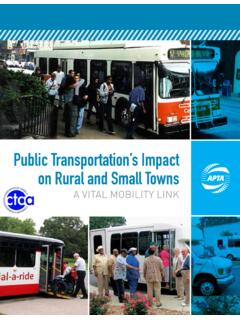
7 This suggests that while more people are traveling outside the home in 2021, the rates have not returned to pre-pandemic were considerable differences among States in the numbers of people who stayed home per day through-out the pandemic. Gulf Coast States regularly had the lowest percentages of people staying home since March 2020. Washington, DC, New York, and the West Coast States had the highest percentages of people staying home. Figure 1 shows the change by month in number of States that experienced less than 21%, 21 to , or more than 29% of their populations staying home each day in 2019, 2020, and through June 2021. These percent-age ranges were selected to illustrate changes at the extremes from March to December 2020. The increasing number of States in which fewer than 21% of the popu-lation stayed home per day in 2021 suggests that these locations may be experiencing travel that approaches pre-pandemic 1 Number of States in Which Different Percentages of the Population Stayed Home per Day0102030405060 JunMayAprMarFebJanDecNovOctSepAugJulJunM ayAprMarFebJanDecNovOctSepAugJulJunMayAp rMarFebJanNumber of States201920202021<21% >29%MonthSource: data showed the proportion of the popula-tion who stayed home at the highest levels for the year in November (29%) and December ( ) of 2020 (see Figure 2).
8 The proportion of the population staying home to-date in 2021 is higher than 2019 but is gen-erally lower than during the 2020 post-public health e m e r g e n c s Of ce of Behavioral Safety Research 1200 New Jersey Avenue SE, Washington, DC 20590 Figure 2 Percentage of People Staying Home per Day by Month, 2019, 2020, and First Half of 202105101520253035 DecNovOctSepAugJulJunMayAprMarFebJanPerc ent of People Staying Home201920202021 MonthSource: 1 Interested readers can explore earlier years NEMSIS data and data added after Week 30, 2021 at In 2020 the NEMSIS database analysis year was 53 (2021) reported VMT on urban and rural roads in the first half of 2021, which indicates that compared to 2020, VMT on urban roads increased by For 2020 compared to 2019, VMT on urban roads decreased This suggests an approximate return to the VMT levels from 2019 in 2021.
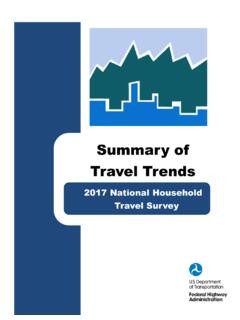
9 The VMT on rural roads in the first half of 2021 increased compared to 2020. In 2020 compared to 2019, the VMT on rural roads decreased by in Crash RatesNHTSA used the NEMSIS database that includes EMS activations from 49 States and Territories to explore changes in a range of crash-related metrics that occurred between 20191 and first 34 weeks of 2021. NHTSA uses rates partly because the number of agencies contribut-ing data increases each year. Therefore, counts of inci-dents compared across years could be misleading due to increases in the number of participating entities. The first metric is the rate of motor vehicle crashes (MVCs) per EMS activation (Figure 3),2 perhaps a leading indi-cator of roadway fatalities (one would expect EMS acti-vation decreases compared to the previous year to be associated with decreases in fatalities).
10 Further analysis is required to determine what factors contributed to the decreased rate that counterintuitively occurred as road fatalities increased. Preliminary analysis conducted by the NEMSIS Technical Assistance Center (Mann, 2021) suggests the rates per EMS activation for influenza-like illness (which includes COVID symptoms), cardiac arrest, scene of death, opioid-related, and mental/behavioral-related activations all increased in 2020 compared to 2019. Further, the rates seen in 2021 have not regressed to pre-pandemic levels for these EMS activations. These increases could mask changes in crash rates, especially in the severity of crashes, as hypothesized by their asso-ciations with increased alcohol use, speed increases, and ejections from vehicles.