Transcription of UBS House view
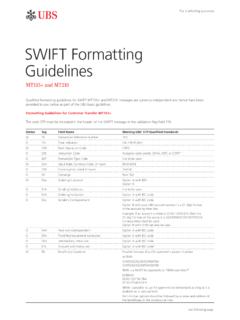
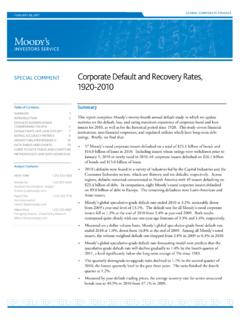
1 UBS House viewMonthly Base August 2018 Chief Investment Office GWMP ublishedJul 19 2018 This report was prepared by UBS see the important disclaimer at the end of the document is a snapshot view . We update the tactical asset allocationas changes occur and resend it to subscribers. For all other forecasts andinformation, we advise you to check the Investment Views section in your E-Banking or in further information please contact Head CIO Global Asset Allocation Andreas J Koester, or CIO asset class specialists Philipp Sch ttler, or Carolina Corvalan, Financial Market Outlook short term Earnings expectations still advancingNet earnings revision ratio MSCI ACWorld, 3mma-15%-10%-5%0%5%10%15%201020112012201 320142015201620172018 NetearningsrevisionratioMSCIACW orld,3mmaSource.
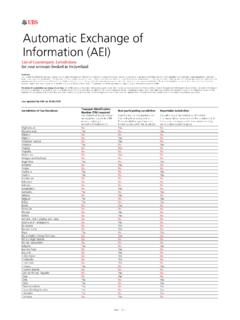
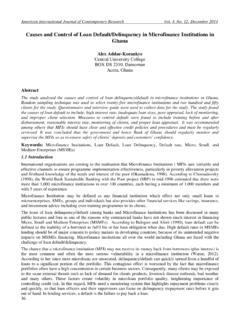
2 Thomson Reuters, UBS, July 17 2018 TWDJPY: a better hedge againstglobal/US equity market volatility, negative correlation with VIX,compared to (USDJPYvsVIX,30wrollingperiod)Weeklycorr elation(TWDJPYvsVIX,30wrollingperiod)Sou rce: Bloomberg, UBS, as of 6 July 2018 Global Tactical Asset Allocation Asset allocationWhile the global economic growth backdrop remains solid and we are starting to see signs of ex-US growth picking up again, trade tensions havenot shown any sign of abating. The US Administration has released a list of USD 200bn of Chinese imports that would be subject to a 10% tariff,raising the prospect of further retaliation if implemented.
3 While the direct economic impact of announced measures is expected to be relativelycontained, the indirect effect of further trade escalations - lower business and investor confidence - could lead to more substantial negative effectson growth and asset prices. In light of the increased downside risks, we are reducing our allocation to global equities. EquitiesDespite the imposition of tariffs on imported goods by the US and China and the threat of further tariffs, global equities held up well. Robusteconomic data in the US and first signs that Europe is leaving the soft patch behind supported markets.
4 First earnings results were also earnings growth of about 15% year-on-year should support global equities this year. However, with the debate on trade tariffs mostlikely intensifying over the summer, volatility is likely to stay high. We are therefore closing our global equities overweight against HG bonds. BondsWe remain underweight euro high yield bonds, but we are shifting the overweight from a pure equities exposure to a mix of equities and highgrade (HG) bonds, thus further de-risking our positioning. We maintain our overweight in EM sovereign bonds in USD.
5 While they remainexposed to an escalation in trade tensions, growth expectations have adjusted downwards, issuance is expected to ease for the rest of the yearand higher oil prices are supportive. We are overweight 10-year US Treasury bonds versus USD cash, a position that should benefit from theattractive carry. We are underweight 10-year Japanese government bonds against JPY cash. The Bank of Japan (BoJ) is likely to raise the target ofits yield-curve control later this year, while an interest-rate cut looks unlikely.
6 Foreign exchangeWe close our long Indian rupee (INR) versus short Taiwanese dollar (TWD) position and replace our long JPY versus short USD with a long JPYversus short TWD position. Inflation risks in India have increased on the back of rising oil prices and increasing farm prices. Tighter monetarypolicy could weigh on India s growth outlook, while higher oil prices would put pressure on the current account deficit. We still expect theTWD to weaken as Taiwan is very exposed to risks arising from US trade policy disputes.
7 The long JPY position should benefit either from risingJapanese inflation convincing the BoJ to raise its 10-year yield target, or a downturn in global financial markets creating demand for the JPY'ssafe-haven preferences We don't Global equities ( ) US smart beta "Buy-write" strategy on US equities Some protection via US equity put optionsBonds EM sovereign bonds in USD 10-year US Treasuries vs. USD cash US leveraged loans Selected EM bonds Long-dated USD high grade bonds Developed market high grade bonds ( ) Euro high yield 10-year Japanese govt.
8 Bonds vs. JPY cash "Well-worn" bondsForeign exchange Japanese yen ..Taiwan dollar ( )Hedge Funds Navigating rising US rates with hedgefundsPrecious Metals& Commodities Recent upgrades Recent downgrades Model portfolios (EUR & USD) Liquidity5% UBS, as of 19 July 2018 Note: Portfolio weightings are for a EUR model portfolio and aUSD model portfolio, with a balanced risk profile (including TAA).We expect the EUR balanced portfolio (excluding TAA) to havean average total return of and a volatility of 8% the next seven years.
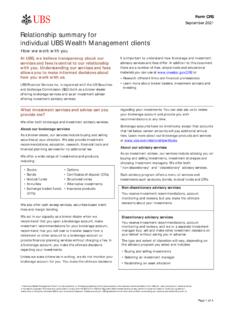
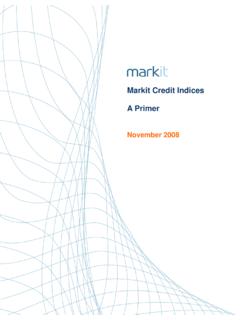
9 We expect the USD balanced portfolio(excl. TAA) to have an average total return of and avolatility of over the next seven years. 3 Global tactical asset allocationTactical asset allocation deviations from benchmark*LiquidityEquitiestotal**Global USEurozoneUKSwitzerlandCanadaJapanEmergi ngmarkets(EM)OthersBondstotalHighgradebo ndsCorporatebonds(IG)Highyieldbonds**EMs overeignbonds(USD)EMcorporatebonds(USD)E MlocalcurrencybondsUSTIPSD urationoverlay(USD)Durationoverlay(JPY)n ewoldneutraloverweightunderweightSource.
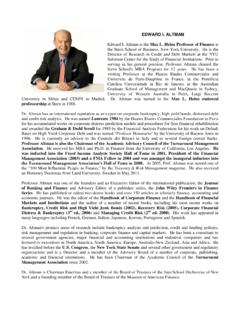
10 UBS, as of 19 July 2018*Please note that the bar charts show total portfolio preferences, which can be interpreted as therecommended deviation from the relevant portfolio benchmark for any given asset class and sub-asset class.**We are holding a put option on the S&P 500 to partly protect the tactical overweight in global equities.**Position includes an underweight in EUR HY. Currency allocationUSDEURGBPJPYCHFSEKNOKCADNZDAUD BRLTWDINR newoldneutralunderweightoverweightSource : UBS, as of 19 July 20184 CIO themes in focus Equities US smart beta Certain stock characteristics (momentum, quality, small capitalization, risk-weighting, value, and yield) have been shown to deliver long-term investment outperformance relative to a market-capitalization-weighted index.