Transcription of UNCTAD B2C E-commerce Index 2018 - Focus on Africa
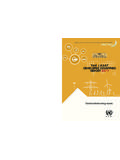
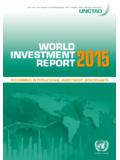
1 United nations ConferenCe on trade and developmentUNCTADUNITED NATIONSUNCTAD B2C E-commerce Index 2018 Focus ON AFRICAUNCTAD Technical Notes on ICT for DevelopmentN 12 1 UNCTAD B2C E-commerce Index 2018 Focus on Africa Improved coverage in 2018 edition The 2018 UNCTAD B2C E-commerce Index , which measures an economy s preparedness to support online shopping, has expanded its coverage to include 151 economies, up seven from the 2017 edition. The Index consists of four indicators that are highly related to online shopping and for which there is wide country coverage (box 1).1 The extent to which people shop online in a country is highly correlated with the value of the Index , with an adjusted R squared value of (Figure 1). Box 1. UNCTAD B2C E-commerce Index methodology The Index is calculated as the average of four indicators ( , each indicator carries the same weight) using data for 2017 or the latest available.
2 Account ownership at a financial institution or with a mobile-money-service provider (% of population ages 15+) (Source: World Bank) Individuals using the Internet (% of population) (Source: International Telecommunication Union, ITU) Postal Reliability Index (Source: Universal Postal Union, UPU) Secure Internet servers (per 1 million people) (Source: Netcraft) Account ownership data are sourced from the World Bank Findex survey, which is carried out every three years, with latest survey in 2017 . Therefore, 2016 data have been estimated based on the Compound Annual Growth Rate (CAGR) between 2014-17. In cases where there was no survey in 2014 but there was one in 2011 and 2017 , intervening years are estimated based on the 2011-17 CAGR. Older data were used as a basis for the estimates when only surveys conducted prior to 2014 or 2011 were available.
3 Secure Internet servers per 1 million people is normalized with this formula: Log (secure server penetration)-Log (maximum value) / Log (maximum value) / Log (minimum value) *100. As noted there was a significant rise in secure servers for some countries in 2017 and revisions in earlier years. UPU postal reliability data is available for 2015-17. If there are no data for a country in 2017 , then the previous year s data are used. At the time of this report, 2017 Internet use data from the ITU were available for less than half of the countries in the Index . In some cases, surveys have been used to update the data. If no survey was available, then 2016 data is used. Country ranks for 2016 are shown as in the previous version of the Index . However, given revisions to the data, the increase in score is based on the revised value for 2016.
4 Source: UNCTAD . 1 For more information on the methodology see: UNCTAD . 2017 . UNCTAD B2C E-commerce Index 2017 . UNCTAD Technical Notes on ICT for Development, No. 9. 2 The release of new account ownership data from the World Bank s 2017 Global Findex survey2 has increased the number of countries included and allows for an estimation of account data for the intervening years since the last survey in 2014. Furthermore, the 2017 FINDEX survey includes for the first time data on the proportion of the age 15+ population which has used the Internet to buy something online. This allows the Index to be tested for robustness using a harmonized data set of online shoppers. There were significant revisions to data on the availability of secure servers. According to Netcraft, the company that carries out the survey, there was a sharp rise for some countries due to drives from browser vendors for increased security and the availability of free, easy-to-use certificates.
5 Postal reliability scores fluctuated significantly in 2017 as postal operators adjusted to growing parcel volumes from increased online shopping. Figure 1. Relationship between UNCTAD B2C E-commerce Index values and online shopping Source: UNCTAD . 2 R = Online (% 15+), 2017 UNCTAD B2C E-commerce Index 2018 3 The Netherlands ascends to the top of the Index Eight of the top ten countries on the Index are in Europe (Table 1). Index values are extremely close, with a range of just four points between first and tenth rank. For the first time, the Netherlands is the highest ranked country in the Index , up three positions from the last year. It replaced Luxembourg, which dropped out of the top ten as a result of a sharp drop in its postal reliability score. The Netherlands has high values for most indicators (Box 1), particularly secure servers where it is top ranked among all countries included in the Index .
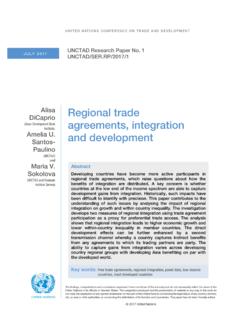
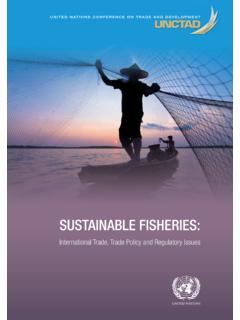
6 Secure servers is used as a proxy for E-commerce shops, and the Netherlands had over 40 000 pure play online retailers in 2016, the highest figure in the European Union (Figure 2, left).3 The country has the second highest proportion of online shoppers in the world (76% of the population aged 15 and older). Singapore and Switzerland are in second and third place. Singapore has surged 16 positions from the last edition, with increased values across all indicators. It now ranks among the top countries in accounts, secure server penetration and postal reliability. E-commerce giant Alibaba is an investor in Singapore Post, which in fiscal year 2018 reported that over half its revenue was E-commerce related (Figure 2, right).4 Internet use is, however, below average and the country s level of online shopping is lower than what it should be given its high Index rank.
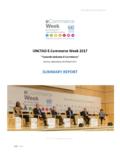
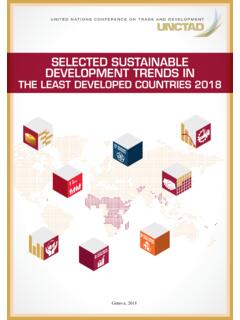
7 This may partly reflect the fact that the main reason Internet users do not shop online in Singapore is they prefer to shop in person, a factor not measured in the Switzerland rates favorably on all indicators and according to its national postal operator: Switzerland has all the ingredients it needs to be one of the best E-commerce markets in the world. 6 The Confederation had the second highest average online spend among European countries in 2016 (Figure 3, left). The United Kingdom has climbed to fourth position. Along with the Netherlands and Switzerland, the United Kingdom has all of its Index indicator values at 90 or above. Such a conducive environment for online shopping is reflected in the country having the largest B2C revenues in Europe and the world s highest proportion of B2C revenues to GDP (Figure 3, right).
8 Norway and Sweden, 5th and 8th respectively, are among four Nordic nations included in the top ten. They have among the world s highest values for all of the indicators except secure server penetration. High levels of Internet access, payment methods and reliable postal delivery are driving online shopping to among the highest levels in the world (3rd and 6th world ranking in the proportion of population that has bought something online). Iceland, ranked 6th, has near ubiquitous Internet access with 98% of the population online, the highest in the world along with Bahrain and Norway. Its score is brought down by a relatively low level of postal reliability, possibly a reflection of challenging terrain and 3 See Annual detailed enterprise statistics for trade (NACE Rev.)
9 2 G) on the Eurostat database at: 4 Singapore Post. 2018. Annual Report 2017 /18. 5 Infocomm Media Development Authority. 2018. Annual Survey on Infocomm Usage in Households and by Individuals for 2017 . 6 Asendia. The secrets of E-commerce success in Switzerland. 4weather conditions in the nation. One alternative is drone delivery which has been launched by Iceland s biggest B2C E-commerce Figure 2. Top ten countries by pureplay web shops per 1 million people, European Union and Singapore Post E-commerce related revenue, FY 2018 Note: Pureplay web shops are equivalent to ISIC 4791 Retail sale via mail order houses or via Internet. Singapore E-commerce related revenue relates to cross-border deliveries under its postal segment, warehousing and last-mile delivery under its logistics segment and front-end related revenue under its eCommerce segment.
10 Source: Eurostat and Singapore Post. Figure 3. Annual online spend, Europe, 2016 and B2C E-commerce revenue as a % of GDP, Top 5 countries, 2016 Source: Asendia (left chart) and United Kingdom Office of National Statistics, China Bureau of Statistics, Malaysia Department of Statistics, Central Bank of Ireland, Electronic Transactions Development Agency of Thailand and World Bank (for exchange rates and GDP). 7 Greg Nichols. 2018. Iceland's answer to Amazon adds drone routes to urban deliveries. ZDNet, 7 August. - ten countries in EU by pureplay web shops per 1 million people, 2016 Pureplay shops (000s)Per 1 million peopleNon- E-commerce related revenue45% E-commerce related revenue55% E-commerce related revenue, Singapore Post, FY2018$2'741 $2'377 $1'812 $1'799 $1'699 $1'338 United KingdomSwitzerlandGermanyItalySpainFranc eAnnual online spend (US$), Europe, 5 countries, B2C sales (% of GDP), 2016 5 Ireland is ranked 7th, advancing 12 positions due to notable increases in secure servers and postal reliability.