Example: stock market
Understanding the Dependent t Test
1. The dependent variable (difference scores) is normally distributed in the two conditions. 2. The independent variable is dichotomous and its levels (groups or occasions) are paired, or matched, in some way (e.g., pre-post, concern for pay-concern for security, etc.).
Tags:
Information
Domain:
Source:
Link to this page:
Documents from same domain
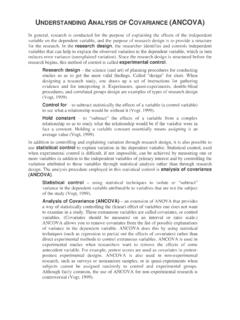
UNDERSTANDING ANALYSIS OF COVARIANCE (ANCOVA)
oak.ucc.nau.edustated, whether the adjusted group means differ significantly from each other. With a one-way analysis of covariance, each individual or case must have scores on three variables: a factor or independent variable, a covariate, and a dependent variable. The factor divides individuals into two or more groups or levels, while

A BRIEF INTRODUCTION TO MULTIVARIATE ANALYSIS OF …
oak.ucc.nau.eduA BRIEF INTRODUCTION TO MULTIVARIATE ANALYSIS OF VARIANCE (MANOVA) Like the analysis of variance (ANOVA), the multivariate analysis of variance (MANOVA) has variations. For example, the one-way MANOVA contains a single factor (independent variable)

Interpreting the One-way MANOVA
oak.ucc.nau.eduTests the null hypothesis that the observed covariance matrices of the dependent variables are equal across groups. a. Design: Intercept+FathEduc The following is the MANOVA using the Wilk’s Lambda test. Using an alpha level of .05, we see that this test is significant, Wilk’s = .66, F(4, 142) = 8.12, p < .001, multivariate 2 = .19.

INTERPRETING THE ONE WAY ANALYSIS OF …
oak.ucc.nau.eduINTERPRETING THE ONE-WAY ANALYSIS OF VARIANCE (ANOVA) As with other parametric statistics, we begin the one-way ANOVA with a test of the underlying assumptions. Our first assumption is the assumption of independence.
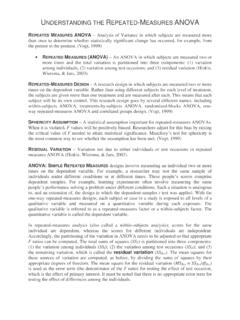
REPEATED MEASURES (ANOVA) - Welcome to …
oak.ucc.nau.eduUNDERSTANDING THE REPEATED-MEASURES ANOVA REPEATED MEASURES ANOVA – Analysis of Variance in which subjects are measured more than once to determine whether statistically significant change has occurred, for example, from

CALCULATIONS IN THE ANALYSIS OF VARIANCE …
oak.ucc.nau.eduCALCULATIONS IN THE ANALYSIS OF VARIANCE (ANOVA) Howell, D. C. (2007). Statistical Methods for Psychology (6th ed.). Pacific Grove, CA: Duxbury. Summary Table for the One-way ANOVA

Leviathan (1651 Head edition; Hackett Publishing, edited ...
oak.ucc.nau.eduLeviathan (1651 Head edition; Hackett Publishing, edited by Edwin Curley, 1994) Thomas Hobbes Introduction: (Hobbes’ Introduction is quite brief, but it is an exceptionally helpful explanation of what Hobbes plans to do in Leviathan, and rewards close reading.) 1.
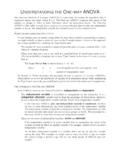
Understanding the One-way ANOVA
oak.ucc.nau.eduUNDERSTANDING THE ONE-WAY ANOVA The One-way Analysis of Variance (ANOVA) is a procedure for testing the hypothesis that K population means are equal, where K > 2. The One-way ANOVA compares the means of the samples or groups in order to make inferences about the population means. The One-way

The Friedman Test - Welcome to oak.ucc.nau.edu
oak.ucc.nau.eduKenda l's Wa Chi-Square df Asymp Sig a. Kendall's Coefficient of Concordance. FRIEDMAN TEST PAGE 5 The Friedman test, which evaluated differences in medians among the three job concerns, is significant c2(2, N = 30) = 13.96, p < .01. Kendall’s W …

The Kruskal-Wallis Test - Northern Arizona University
oak.ucc.nau.eduKRUSKAL-WALLIS TEST PAGE 7 Test Statisticsb 24.500 79.500-1.939. 052.052a Ma n-Whit ey U Wilc ox n Z Asymp S ig (2-ta led) Ex ac t Sig.[2*(1- led )] Diff_Score a. Not corrected for ties.
Related documents
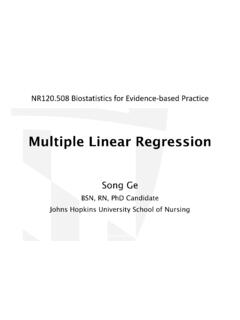
Multiple Linear Regression
blackboard.jhu.edu2. The dependent variable must be of ratio/interval scale and normally distributed overall and normally distributed for each value of the independent variables 3. For every value of X, the distribution of Y scores must have approximately equal variability (homoscedasticity) 4. The relationship between X and Y must be linear 5.
The Central Limit Theorem
www.stat.ucla.edun are i.i.d. (independent and identically distributed) random variables having the same distribution with mean , variance ˙2, and moment generating function M X(t), then if n!1 the limiting distribution of the random variable Z= T n ˙ p n (where T= X 1 +X 2 + +X n) is the standard normal distribution N(0;1). Proof: M Z(t) = M T n ˙ p n (t ...

ardl: Stata module to estimate autoregressive distributed ...
www.stata.comnormally distributed irrespective of the order of integration. Bounds procedure for testing the existence of a long-run relationship based on the EC representation of the ARDL model: Pesaran, Shin, and Smith (2001) tabulate asymptotic critical values that span a band from all regressors being purely I(0) to all regressors being purely I(1).