Example: barber
Understanding the Dependent t Test
subjects, simple repeated-measures or within-groups, or correlated groups) assesses whether the mean difference between paired/matched observations is significantly different from zero. That is, the dependent-samples t test procedure evaluates whether there is a significant difference between the means of the two variables (test occasions or ...
Tags:
Information
Domain:
Source:
Link to this page:
Documents from same domain
Understanding the One-way ANOVA
oak.ucc.nau.eduUNDERSTANDING THE ONE-WAY ANOVA The One-way Analysis of Variance (ANOVA) is a procedure for testing the hypothesis that K population means are equal, where K > 2. The One-way ANOVA compares the means of the samples or groups in order to make inferences about the population means. The One-way
UNDERSTANDING ANALYSIS OF COVARIANCE (ANCOVA)
oak.ucc.nau.edustated, whether the adjusted group means differ significantly from each other. With a one-way analysis of covariance, each individual or case must have scores on three variables: a factor or independent variable, a covariate, and a dependent variable. The factor divides individuals into two or more groups or levels, while

Interpreting the One-way MANOVA
oak.ucc.nau.eduTests the null hypothesis that the observed covariance matrices of the dependent variables are equal across groups. a. Design: Intercept+FathEduc The following is the MANOVA using the Wilk’s Lambda test. Using an alpha level of .05, we see that this test is significant, Wilk’s = .66, F(4, 142) = 8.12, p < .001, multivariate 2 = .19.

INTERPRETING THE ONE WAY ANALYSIS OF …
oak.ucc.nau.eduINTERPRETING THE ONE-WAY ANALYSIS OF VARIANCE (ANOVA) As with other parametric statistics, we begin the one-way ANOVA with a test of the underlying assumptions. Our first assumption is the assumption of independence.
REPEATED MEASURES (ANOVA) - Welcome to …
oak.ucc.nau.eduUNDERSTANDING THE REPEATED-MEASURES ANOVA REPEATED MEASURES ANOVA – Analysis of Variance in which subjects are measured more than once to determine whether statistically significant change has occurred, for example, from

CALCULATIONS IN THE ANALYSIS OF VARIANCE …
oak.ucc.nau.eduCALCULATIONS IN THE ANALYSIS OF VARIANCE (ANOVA) Howell, D. C. (2007). Statistical Methods for Psychology (6th ed.). Pacific Grove, CA: Duxbury. Summary Table for the One-way ANOVA

A BRIEF INTRODUCTION TO MULTIVARIATE ANALYSIS OF …
oak.ucc.nau.eduA BRIEF INTRODUCTION TO MULTIVARIATE ANALYSIS OF VARIANCE (MANOVA) Like the analysis of variance (ANOVA), the multivariate analysis of variance (MANOVA) has variations. For example, the one-way MANOVA contains a single factor (independent variable)

Leviathan (1651 Head edition; Hackett Publishing, edited ...
oak.ucc.nau.eduLeviathan (1651 Head edition; Hackett Publishing, edited by Edwin Curley, 1994) Thomas Hobbes Introduction: (Hobbes’ Introduction is quite brief, but it is an exceptionally helpful explanation of what Hobbes plans to do in Leviathan, and rewards close reading.) 1.

The Friedman Test - Welcome to oak.ucc.nau.edu
oak.ucc.nau.eduKenda l's Wa Chi-Square df Asymp Sig a. Kendall's Coefficient of Concordance. FRIEDMAN TEST PAGE 5 The Friedman test, which evaluated differences in medians among the three job concerns, is significant c2(2, N = 30) = 13.96, p < .01. Kendall’s W …

The Kruskal-Wallis Test - Northern Arizona University
oak.ucc.nau.eduKRUSKAL-WALLIS TEST PAGE 7 Test Statisticsb 24.500 79.500-1.939. 052.052a Ma n-Whit ey U Wilc ox n Z Asymp S ig (2-ta led) Ex ac t Sig.[2*(1- led )] Diff_Score a. Not corrected for ties.
Related documents
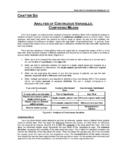
ANALYSIS OF CONTINUOUS VARIABLES COMPARING MEANS
surgicalcriticalcare.netMultiple patient groups ANOVA ANOVA Figure 6-1: Analysis of Continuous Variables COMPARING MEANS There are three factors which determine whether an observed sample mean is different from another mean or normal value. First, the larger the difference between the means, the more likely the difference has not occurred by chance.
SPSS: Descriptive and Inferential Statistics
stat.utexas.eduThe t test is a useful technique for comparing mean values of two sets of numbers. The comparison will provide you with a statistic for evaluating whether the difference between two means is statistically significant. T tests can be used either to compare two independent groups (independent-samples t test) ...
Comparing Means Between Groups - UMass Amherst
courses.umass.eduI Comparing means between groups is an important method for program evaluation by policy analysts and public administrators. I The question \Does a program work?" is often answered in terms of the program’s e ect on the mean of an important outcome variable by comparing the mean of a treated group and a comparison group.
Multiple groups and comparisons
www.ctc.ucl.ac.ukbetween groups, i.e. how they differ from the overall mean of 24.3 • Both samples have the same differences between group (A, B or C) means – we can say variation between means in each data set is the same • But the variability within a sample in each set is different. Set 1 is tighter around its mean (lower SDs) than set 2.
CHAPTER 3 COMMONLY USED STATISTICAL TERMS
www.sagepub.comassess comparisons between correlations, percentages, mean differences, probabilities, and so on. Eta ( ): An index that indicates the degree of a curvilinear relationship. F-test (F): A parametric statistical test of the equality of the means of two or more samples. It compares the means and variances between and within groups over time. It is
Disparities in COVID-19 Vaccination Rates across Racial ...
aspe.hhs.govFor the purposes of comparing the racial and ethnic demographics of the vaccinated population to the racial and ethnic demographics of vaccine priority groups, three non-overlapping cohorts were identified: adults over the age of 65, healthcare workers under the age of 65, and non-healthcare essential workers under the age of 65.
A Short History of Sexual Harassment - Yale Law School
law.yale.eduity and legitimacy of slavery. And sexual relationships between women and the men for whom they worked as domestic servants were, if anything, even more volubly discussed. Over the decades, governmental hearings and reports, as well as all manner of commentary in the public press, delved into this and other aspects of the "servant problem."