Transcription of Understanding the Independent t Test
1 Understanding THE Independent -SAMPLES t TEST. The Independent -samples t test evaluates the difference between the means of two Independent or unrelated groups. That is, we evaluate whether the means for two Independent groups are significantly different from each other. The Independent -samples t test is commonly referred to as a between-groups design, and can also be used to analyze a control and experimental group. With an Independent -samples t test, each case must have scores on two variables, the grouping ( Independent ) variable and the test (dependent) variable. The grouping variable divides cases into two mutually exclusive groups or categories, such as boys or girls for the grouping variable gender, while the test variable describes each case on some quantitative dimension such as test performance. The t test evaluates whether the mean value of the test variable ( , test performance) for one group ( , boys) differs significantly from the mean value of the test variable for the second group ( , girls).
2 HYPOTHESES FOR THE Independent -SAMPLES t TEST. Null Hypothesis: H0: 1 = 2 where 1 stands for the mean for the first group and 2 stands for the mean for the second group. -or- H0: 1 2 = 0. Alternative (Non-Directional) Hypothesis: Ha: 1 2 -or- Ha: 1 2 0. Alternative (Directional) Hypothesis: Ha: 1 < 2 -or- Ha: 1 > 2. (depending on direction). NOTE: the subscripts (1 and 2) can be substituted with the group identifiers For example: H0: Boys = Girls Ha: Boys Girls ASSUMPTIONS UNDERLYING THE Independent -SAMPLES t TEST. 1. The data (scores) are Independent of each other (that is, scores of one participant are not systematically related to scores of the other participants). This is commonly referred to as the assumption of independence. 2. The test (dependent) variable is normally distributed within each of the two populations (as defined by the grouping variable). This is commonly referred to as the assumption of normality.
3 3. The variances of the test (dependent) variable in the two populations are equal. This is commonly referred to as the assumption of homogeneity of variance. Null Hypothesis: H0: 12 = 22 (if retained = assumption met). (if rejected = assumption not met). Alternative Hypothesis: Ha: 12 22. TESTING THE ASSUMPTION OF INDEPENDENCE. One of the first steps in using the Independent -samples t test is to test the assumption of independence. Independence is a methodological concern; it is dealt with (or should be dealt with) when a study is set up. Although the independence assumption can ruin a study if it is violated, there is no way to use the study's sample data to test the validity of this prerequisite condition. It is assessed through an examination of the design of the study. That is, we confirm that the two groups are Independent of each other? The assumption of independence is commonly known as the unforgiving assumption ( , robustness), which simply means that if the two groups are not Independent of each other, one cannot use the Independent -samples t test.
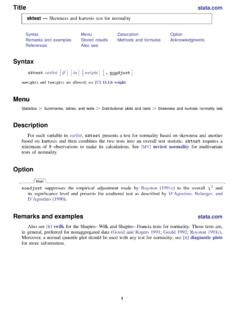
4 TESTING THE ASSUMPTION OF NORMALITY. Another of the first steps in using the Independent -samples t test is to test the assumption of normality, where the Null Hypothesis is that there is no significant departure from normality, as such; retaining the null hypothesis indicates that the assumption of normality has been met for the given sample. The Alternative Hypothesis is that there is a significant departure from normality, as such;. rejecting the null hypothesis in favor of the alternative indicates that the assumption of normality has not been met for the given sample. To test the assumption of normality, we can use the Shapiro- wilks test. From this test, the Sig. (p) value is compared to the a priori alpha level (level of significance for the statistic) . and a determination is made as to reject (p < ) or retain (p > ) the null hypothesis. Tests of Normality a Kolmogorov-Smirnov Shapiro-Wilk Stress Condition Statistic df Sig.
5 Statistic df Sig. Percentage of time talking Low Stress .229 15 .033 .917 15 .170. High Stress .209 15 .076 .888 15 .062. a. Lilliefors Significance Correction For the above example, where = .001, given that p = .170 for the Low Stress Group and p =..062 for the High Stress Group we would conclude that each of the levels of the Independent Variable (Stress Condition) are normally distributed. Therefore, the assumption of normality has been met for this sample. The a priori alpha level is typically based on sample size where .05 and .01 are commonly used. Tabachnick and Fidell (2007) report that conventional but conservative (.01 and .001) alpha levels are commonly used to evaluate the assumption of normality. NOTE: Most statisticians will agree that the Shapiro- wilks Test should not be the sole determination of normality. It is common to use this test in conjunction with other measures such as an examination of skewness, kurtosis, histograms, and normal Q-Q plots.
6 THE Independent -SAMPLES t TEST. PAGE 2. In examining skewness and kurtosis, we divide the skewness (kurtosis) statistic by its standard error. We want to know if this standard score value significantly departs from normality. Concern arises when the skewness (kurtosis) statistic divided by its standard error is greater than z + (p < .001, two-tailed test) (Tabachnick & Fidell, 2007). We have several options for handling non-normal data, such as deletion and data transformation (based on the type and degree of violation as well as the randomness of the missing data points). Any adjustment to the data should be justified ( , referenced) based on solid resources ( , prior research or statistical references). As a first step, data should be thoroughly screened to ensure that any issues are not a factor of missing data or data entry errors. Such errors should be resolved prior to any data analyses using acceptable procedures (see for example Howell, 2007 or Tabachnick & Fidell, 2007).
7 TESTING THE ASSUMPTION OF HOMOGENEITY OF VARIANCE. Another of the first steps in using the Independent -samples t test statistical analysis is to test the assumption of homogeneity of variance, where the null hypothesis assumes no difference between the two group's variances (H0: 12 = 22 ). The Levene's F Test for Equality of Variances is the most commonly used statistic to test the assumption of homogeneity of variance. The Levene's test uses the level of significance set a priori for the t test analysis ( , = .05) to test the assumption of homogeneity of variance. Independent Samples Test Levene's Test for Equality of Variances F Sig. VISUAL Equal variances .000. Visualization Test assumed Equal variances not assumed For Example: For the VISUAL variable (shown above), the F value for Levene's test is with a Sig. (p) value of .000 (p < .001). Because the Sig. value is less than our alpha of.
8 05 (p < .05), we reject the null hypothesis (no difference) for the assumption of homogeneity of variance and conclude that there is a significant difference between the two group's variances. That is, the assumption of homogeneity of variance is not met. If the assumption of homogeneity of variance is not met, we must use the data results associated with the Equal variances not assumed, which takes into account the Cochran &. Cox (1957) adjustment for the standard error of the estimate and the Satterthwaite (1946). adjustment for the degrees of freedom. In other words, we will use the bottom line of the t test for equality of means results table and ignore the top line of information. Had the Sig. (p) value been greater than our a priori alpha level, we would have retained the null hypothesis and concluded that there is not a significant difference between the two group's variances.
9 If the assumption of homogeneity of variance is met, we must use the data results associated with the Equal variances assumed, and interpret the data accordingly. That is, we would use the top line of information for the t test. THE Independent -SAMPLES t TEST. PAGE 3. Independent Samples Test t-test for Equality of Means 95% Confidence Interval of the Mean Std. Error Difference t df Sig. (2-tailed) Difference Difference Lower Upper VISUAL Equal variances 498 .000 .346194 Visualization Test assumed Equal variances .001 .355259 not assumed For this example (testing the difference between males and females on the Visualization test), since the t value ( , which indicates that the second group was higher than the first group) resulted in a Sig. (p) value that was less than our alpha of .05 (p < .05, which puts the obtained t in the tail) we reject the null hypothesis in support of the alternative hypothesis, and conclude that males and females differed significantly on their Visualization test performance.
10 By examining the group means for this sample of subjects (not shown here), we see that males (with a mean of ) performed significantly higher on the Visualization test than did females (with a mean of ). VIOLATION OF THE ASSUMPTIONS OF THE t TEST FOR Independent GROUPS. The Independent -samples t test is what we refer to as a robust test. That is, the t test is relatively insensitive (having little effect) to violations of normality and homogeneity of variance, depending on the sample size and the type and magnitude of the violation. If n1 = n2 and the size of each sample is equal to or greater than 30, the t test for Independent groups may be used without appreciable error despite moderate violations of the normality and/or the homogeneity of variance assumptions (Pagano, 2004, p. 339). Sample sizes can be considered equal if the larger group is not more than 1 times larger than the smaller group (Morgan, Leech, Gloeckner, & Barrett, 2004).