Transcription of Repeated measures (within-subjects) ANOVA
1 Repeated measures ANOVA in SPSS statstutor Community Project Ellen Marshall Reviewer: Alun Owen University of Sheffield University of Worcester stcp-marshall- ANOVA Repeated Repeated measures (within-subjects) ANOVA Dependent variable: Continuous (scale/interval/ratio), Independent variable: Categorical time/ condition (within subjects factor) Common Applications: Used when several measurements of the same dependent variable are taken at different time points or under different conditions. Repeated measures ANOVA analyses (1) changes in mean score over 3 or more time points or (2) differences in mean score under 3 or more conditions.
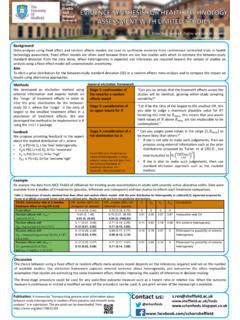
2 This is the equivalent of a one-way ANOVA but for Repeated samples and is an extension of a paired-samples t-test. Repeated measures ANOVA is also known as within-subjects ANOVA . Assumptions for Repeated measures ANOVA Assumptions How to check What to do if the assumption is not met Normality of residuals by time point In the Save menu, ask for the standardised residuals. A set of residuals will be produced for each time point and added to the data set. Use histograms/ Shapiro-Wilk tests to check they are approximately normally distributed.
3 If the residuals are very skewed, ANOVA is not reliable so use the non-parametric Friedman test instead Sphericity: the variances of the differences between all combinations of the related conditions/ time points are equal (similar to the assumption of equal variances in ANOVA ). Mauchly s test of Sphericity is automatically given in the output. If p > , Sphericity can be assumed. Use the p-value from the Greenhouse-Geisser correction row in the Tests of Within-Subjects Effects ANOVA table Data: Participants used Clora margarine for 8 weeks.
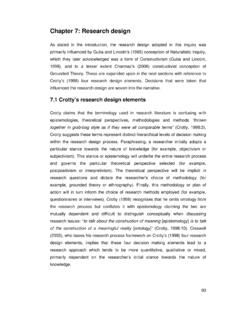
4 Their cholesterol (in mmol/L) was measured before the special diet, after 4 weeks and after 8 weeks. Open the SPSS file and follow the instructions to see if the use of margarine has changed the mean cholesterol. The following resources are associated: Checking normality in SPSS and the SPSS dataset Repeated measures ANOVA in SPSS statstutor Community Project Ellen Marshall Reviewer: Alun Owen University of Sheffield University of Worcester Steps in SPSS To carry out a Repeated measures ANOVA , use Analyse General Linear Model Repeated measures .
5 This screen comes up first. This is where we define the levels of our Repeated measures factor which in our case is time. We need to name it using whatever name we like (we have used time in this case) and then state how many time points there are (which here is 3; before the experiment, after 4 weeks and after 8 weeks). Make sure in your data set there is one row per person and a separate column for each of the three time points or conditions. Make sure you click on the Add button and then click on the Define button.
6 The next screen you see should be the one below. Move the three cholesterol variables across into the Within-Subjects Variables box. Post hoc tests for Repeated measures are in the Options menu. Move time to the Display Means for box and select In the Save menu, ask for the standardised residuals to be added to the dataset (ZRE_1 ZRE_3). These will be added to your dataset by SPSS when you run the analysis. They should then be checked for normality using histograms/ Shapiro-Wilk tests in Analyze Descriptive Statistics Explore.
7 Choose Bonferroni from the Confidence interval adjustment menu Repeated measures ANOVA in SPSS statstutor Community Project Ellen Marshall Reviewer: Alun Owen University of Sheffield University of Worcester The output The test above is significant (p < ) so the assumption of Sphericity has not been met. If Sphericity can be assumed, use the top row of the Tests of Within-Subjects Effects below. If it cannot be assumed, use the Greenhouse-Geisser row (as shown below) which makes an adjustment to the degrees of freedom of the Repeated measures ANOVA .
8 Report the results of this table using [F(dftime, dfError(time))= Test statistic F, p = ..]. Here a Greenhouse-Geisser correction was applied to the degrees of freedom so use [F( , )= , p < ] when reporting the results. As the main ANOVA is significant, this means that there is a difference between at least two time points. The Pairwise comparisons table contains multiple paired t-tests with a Bonferroni correction to keep the Type I error at 5% overall. There was a significant difference between each pair of time points.
9 Cholesterol reduced by mmol/L between baseline and 4 weeks (p < ) and then reduced by an additional mmol/L between 4 and 8 weeks (p = ). Finally, the standardised residuals need to be approximately normally distributed for the ANOVA to be reliable. Histograms of the standardised residuals at the three time points showed an approximate normal distribution. As p < , there s a difference in cholesterol between at least 2 time points p-value Repeated measures ANOVA in SPSS statstutor Community Project Ellen Marshall Reviewer: Alun Owen University of Sheffield University of Worcester Reporting ANOVA Participants used Clora margarine for 8 weeks.
10 Their cholesterol was measured before the special diet, after 4 weeks and after 8 weeks. Normality checks were carried out on the residuals which were approximately normally distributed. A Repeated measures ANOVA with a Greenhouse-Geisser correction showed that mean cholesterol differed significantly between time points [F( , )= , p < ]. Post hoc tests using the Bonferroni correction revealed that Cholesterol reduced by an average of mmol/L (units?) after 4 weeks (p < ) and then reduced by an additional mmol/L (units?)